Download
1 / 23
230 likes | 362 Views
Evaluation of Effectiveness of Automated Workzone Information Systems. Lianyu Chu CCIT, University of California Berkeley Hee-Kyung Kim, Yonshik Chung, Will Recker University of California Irvine. OUTLINE. Introduction Framework and Operation of CHIPS Safety Effects Diversion Effects

E N D
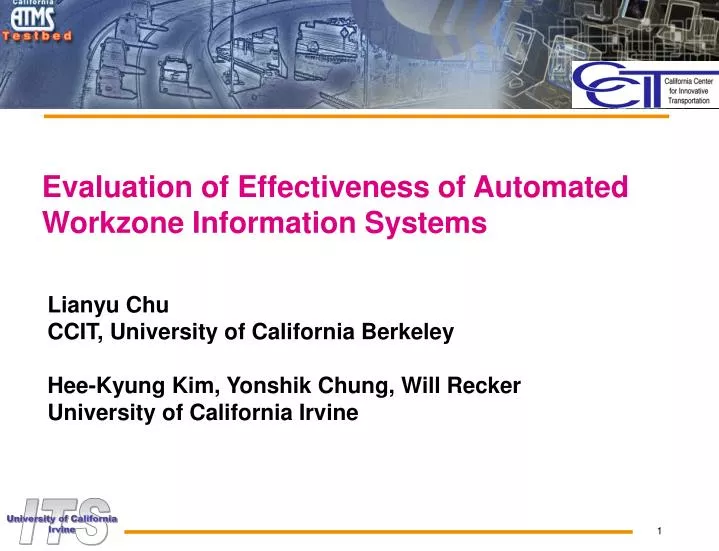
Evaluation of Effectiveness of Automated Workzone Information Systems Lianyu Chu CCIT, University of California Berkeley Hee-Kyung Kim, Yonshik Chung, Will Recker University of California Irvine
OUTLINE • Introduction • Framework and Operation of CHIPS • Safety Effects • Diversion Effects • Driver Survey • Conclusion
Background • work zones have become one of source of traffic congestion Central Controller Traffic Sensors Changeable Message Signs • ITS AWIS • Benefits provide traffic information to travelers potentially: -> increase safety-> improve the efficiency of traffic system
Background • Example of AWIS • ADAPTIR • CHIPS • Smart Zone • TIPS • Evaluation studies • Most studies: system functionality and reliability • Few studies: effectiveness of AWISs
Objectives & approach • Evaluation ofCHIPS • Developed by ASTI • Deployed in southern California • focus: effectiveness • Safety effects • Diversion effects • Drivers’ acceptance • Approach: before and after study
OUTLINE • Introduction • Framework and Operation of CHIPS • System Structure • Study Area • System Setup • Safety Effects • Diversion Effects • Driver Survey • Conclusion
Study Area • Site Location • City of Santa Clarita, 20 miles north of Los Angeles, on freeway I-5 • I-5: 4-lane freeway with the closure of one lane on the median side • Construction zone: 1.5 miles long • Parallel route: the Old Road • System Configuration - 3 RTMSs - 5 PCMSs - 3 CCTV cameras
System Setup T = Queue being detected, F = No queue being detected • Scenario SBS04: all three RTMSs have congestion, the following messages are shown on PCMSs: • CMB06 : SOUTH 5/TRAFFIC/JAMMED, AUTOS/USE NEXT/EXIT • CMB07 : JAMMED/TO MAGIC/MOUNTAIN, EXPECT/10 MIN/DELAY • CMB08 : JAMMED/TO MAGIC/MOUNTAIN, EXPECT/15 MIN/DELAY • CMB09 : TRAFFIC JAMMED TO MAGIC MTN, AVOID DELAY USE NEXT EXIT • CMB11: SOUTH 5 ALTERNAT ROUTE, AUTOS USE NEXT 2 EXITS
OUTLINE • Introduction • Framework and Operation of CHIPS • Safety Effects • Data Collection • Traffic Throughput • Travel Speed • Diversion Effects • Driver Survey • Conclusion
Data Collection • Collection locations • RTMS-1: 0.15 mile before construction • RTMS-2: 1.19 miles before construction • Collection time • Before scenario : Aug. 17th, 2003 • After scenario : Sep. 1st , 2003 • Collection Methods • Jamar DB-100 counters and Bushnell Speed Guns
11.6 6.5 15.7 6.3 44.9 25.4 Traffic Volume Variance • Variance of traffic volume based on 1-min data Difference between before and after values is significant (90% confidence level) • With the grouped traffic data, the difference of variance was significant at RTMS-1, which means that the variance of the after scenario was statistically smaller than that of the before scenario • With lane-based traffic data, the significant differences of variances were found for lane 1 and lane 2 at RTMS-1
Speed Mean and Variance 80.0 50.2 32.4 13.5 Difference between before and after values is significant (90% confidence level) RTMS-1 RTMS-2
OUTLINE • Introduction • Framework and Operation of CHIPS • Safety Effects • Diversion Effects • Data Collection • Calculation of Diversion • Diversion Estimation • Travel Time Analysis • Driver Survey • Conclusion I-5 Old Road Lake Hughes Off-ramp Hasley Canyon Off-ramp SR-126 Rye Canyon Off-ramp Magic Mountain On-ramp Valencia On-ramp Old Road I-5
Data Collection • Collection Methods • I-5 mainline traffic volume : PeMS database • Off-ramp traffic volume : Tube counter • Collection Periods • Before scenario : May 13th~ May 18th,2003 May 18th • After scenario : Independence Holiday weekend (June 30th ~ July 7th, 2003) July 6th Labor Holiday weekend (Aug. 30th ~ Sep. 2nd, 2003) Sep. 1st
V I-5 S Voff Old road Calculation of Diversion • Proportion-based method • Proportion Voff P = V • Diversion rate Voffa Voffb a : after scenario b : before scenario = Pa - Pb = Va Vb • Diversion traffic volume Vd = Va
Diversion Estimation • Hasley Canyon off-ramp traffic proportions
Diversion Estimation • Estimation of diversion traffic volume • Based on Caltran’s traffic report regarding Maximum Delay • On July 6th 15:30 ~ 17:30 • On Sep. 1st 17:30 ~ 20:00
Travel Time Analysis • Comparison of travel times - July 6th ,2003 by GPS-based probe vehicles survey
Driver Survey • Method : Postcard-based survey • Location : Lake Hughes and Hasley Canyon off-ramp • Date : 1:40~4:30 PM, Sunday, July 6th , 2003 • Response rate : 25% (100/400)
Driver Survey • Did the traffic signs influence route choice? • Yes : 78% of people who saw the PCMS message • Why did you get off the I-5 south? • 73% : avoid traffic • 22% : buy gas and foods • 5% : arrived at destination • Did you find these signs useful? (check all that apply) • 70% : useful for providing information • 63% : useful for taking alternative routes • 53% : useful for avoiding delay • 48% : useful for reducing anxiety • 9% : NOT useful
Conclusion • Three aspects of effectiveness studies were conducted, including traffic diversion, safety effects, and responses from travelers • The results of these studies showed that: • Obvious diversion were observed on two evaluation dates, July 6th and September1st • Based on the study of the effects of traffic flow, the driving environment after the use of CHIPS seemed safer • Positive responses about the system were obtained based on driver surveys.
Conclusion • The safety has been enhanced • Stable traffic condition (speed and volume variance) • Network performance improved • 12% of diversion was observed • Alternative was still faster than mainline • Driver response • 70% of drivers expressed the system to be useful • Direct quantification was not made, but found positive effectiveness of the system.