Download
1 / 31
310 likes | 333 Views
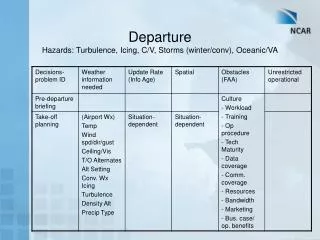
This presentation highlights the Winter Storm Warning Program, verification review, key activities in forecasting, and the relationship between event totals and warning performance in the Eastern US. It assesses the performance trend from 1993-2004 and discusses advancements in forecasting technologies and techniques. The impact of climate regimes on winter storm events is also examined.

E N D
FORECASTING EASTERN US WINTER STORMSAre We Getting Better and Why? Jeff S. Waldstreicher NOAA/NWS Eastern Region Scientific Services Division – Bohemia, NY Northeast Regional Operational Workshop (NROW) November 4, 2004
OUTLINE • Winter Storm Warning Program • Verification Review • Key Activities and Developments • Relationship Between Event Totals and Warning Performance • Summary
MOTIVATION • Winter of 2003-2004 Performance • EASTERN REGION WIDE • POD - .921 • FAR - .321 • Lead Time – 18.5 hours • NORTHEAST • POD - .920 • FAR - .321 • Lead Time – 20.3 hours • Is this indicative of a positive performance trend? • If yes, what are the contributing factors?
WINTER STORM WARNINGVERIFICATION RESULTS 1993-94 to 2003-04
KEY ACTIVITIES AND DEVELOPMENTS RELATED TO FORECASTING WINTER STORMS 1993-2004
NWP ADVANCES • Global Model • 1993 – AVN/MRF at T126/L28 • 2/day AVN to 126h and 1/day MRF to 240h • 2004 – GFS at T256/L64 to 84 h • 4/day to 384h (T170/L42 84-180h T126/L28 to 386h) • Numerous improvements to physics, data assimilation etc… • Medium Range Ensemble Forecast System (MREF) • ~1997 – 1/day 12 member system • 2004 – 4/day 48 member system including lag members • NGM– Static Since 1993
NWP ADVANCES • Eta (NAM) • 1993 – Early Eta 80 km / 38 levels / 00 and 12Z / 48h • 1995 – Meso Eta 32 km / 50 levels / 03 and 15Z / 33h • 2004 – MesoEta 12 km / 60 levels / 4 x day / 84 hr • Numerous improvements to physics, data assimilation etc… • Local Area Modeling - Workstation Eta • Short Range Ensemble Forecast System (SREF) • ~1999 – 10 members (5 48 km Eta / 5 RSM) • 2004 – 15 members (10- 32 km Eta / 5- 40 km RSM) • Rapid Update Cycle (RUC) • ~1994 – RUC1 – 60 km / 25 levels • 1998 – RUC2 – 40 km / 40 levels • 2004 – RUC2 – 20 km / 50 levels
1994-1997 • WSR-88D Network Installation Completed • PCGRIDDS/NAWIPS/GARP • Gridded Model Data into Field Offices • NWS Lake Effect Snow Study • BUFKIT • Expansions of Snow Spotter Networks • Expansion of Collaborative Research Projects (COMET) • First Real-time local model in NWS ER field office (MM5 at BUF and BGM)
1998-2000 • AWIPS Installations Completed • Advanced Workstations w/ Integrated Data Sets • Public Forecast Program Transfers • 1998-99 – BGM/CTP start Winter Warning Program • 1999-00 – AKQ/BTV/CAR/RNK start Winter Warning Program • Pros – New ideas/techniques, Smaller Forecast Areas • Cons – Less experience • Active Teletraining Program Established • Web based training modules
1998-2000 • Regional Workshops/Conferences • Northeast Regional Operational Workshop • Southern New England Workshop • Great Lakes Operational Meteorology Workshop • Northeast Storm Conference • Continued Expansion of COMET Projects • CSTAR Collaborative Research Projects Funded • North Carolina State Univ. – WFO Raleigh (early 2000) • State Univ. of New York at Albany – WFO Albany (late 2000)
2001-2004 • Eastern Region Winter Weather Best Practices Team (2001) • IFPS • Collaborative Forecast Process • HPC Winter Weather Experiment (WWE) • 2001-02 – 4 WFOs (AKQ/LWX/PHI/CTP) • 2002-03 – All Eastern Region • 2003-04 – ~75% of CONUS • 2004-05 – Integrated into routine HPC Operations • Test new collaborative forecast process among HPC and WFOs for winter storm events • Evaluate new products from SREF
2001-2004 • Implementation of CSTAR Research Results • U. at Albany Project • Mesoscale Banding in Winter Storms • Precipitation Microphysics • Cold Season Closed Lows • Terrain-Forced Snow Storms • Impacts of Climate Regimes (ENSO, NAO, etc…) • N.C. State Project • Cold Air Damming • Coastal Fronts • Precipitation Type Forecasting Methodologies • Regional COMET Projects • BTV/McGill Univ. • OKX/Stony Brook Univ.
2001-2004 • Weather Event Simulator (WES) – 2001 • Training Workstation that can simulate real-time data flow and forecast processes • AWIPS Archive Server- 2002 • Local Capability to archive full AWIPS data sets for WES playback • Expansion of local office training activities and workshops
2001-2004 • Coming together of several activities and developments: • Applied Research and Technique Development • Technologies • Training • Operational Application and Procedures
RELATIONSHIP BETWEEN EVENT COUNTS AND WARNING PERFORMANCE IMPACTS OF CLIMATE REGIMES?
MONTHLY NAO/PNA vs. Events • Cumulative Winter (Dec-Jan-Feb-Mar) Monthly Mean NAO shows some correlation to number of winter storm events • Cumulative Winter Monthly Mean PNA shows little or no correlation • Shorter term (daily/weekly) index values likely more important
SUMMARY • Winter storm warning performance appears to be improving across the Northeast • Greatest improvements in Lead Time • Lead Time improvements are not a result of improved POD • No increase in false alarms noted • Event totals impact warning performance • More events – better performance • Most impact on False Alarms and Lead Time
SUMMARY Performance improvements appear to be related to an evolving “end-to-end” collaborative process of: • Discovery and Sharing • Demonstration of Added Value (Operational Utility) • Operational Implementation • Training Activities • Periodic Review and Refinement