Download
1 / 2
20 likes | 152 Views
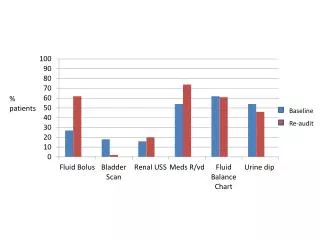
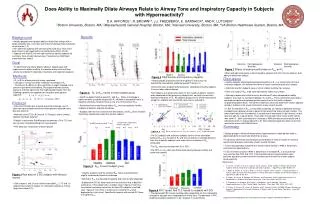
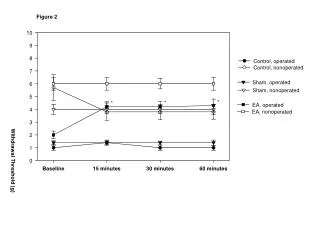
BTR 4.2%. BTR 3.4%. BTR 3.4%. WTR = 3.3-8.3 mmol/L, 60-150 mg/dL. Baseline. 3 Months. 6 Weeks. p = 0.035 for change from baseline to 3 months in WTR and ATR or ATR >240 mg/dl. Legend to the figure:

E N D
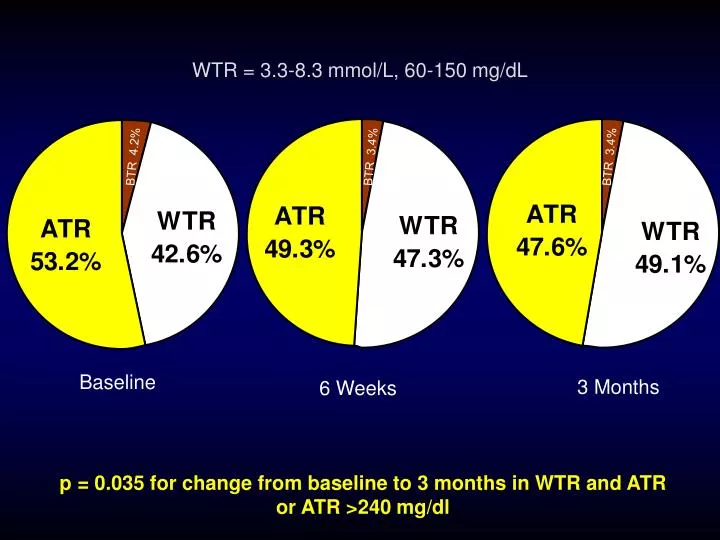
BTR 4.2% BTR 3.4% BTR 3.4% WTR = 3.3-8.3 mmol/L, 60-150 mg/dL Baseline 3 Months 6 Weeks p = 0.035 for change from baseline to 3 months in WTR and ATR or ATR >240 mg/dl
Legend to the figure: Target range glucose values with real-life use of CHMG: There was a significant increase in Within the Target Range (WTR) glycemia without any increase in hypoglycemia (BTR).