Download
1 / 8
80 likes | 208 Views
HERRING IN SD 30. WGBFAS 2009. Update Assessment. WGBFAS 2009. HERRING IN SD 30. INPUT DATA Landings: 65 430 t in 2008 (75 432 t in 2007) 94% caught by Finland; 6% by Sweden, Finland: 40% demersal trawl, 54% pelagic trawl, 5% trapnet,<0.2% gillnet

E N D
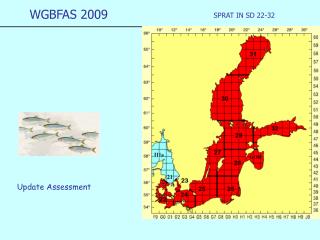
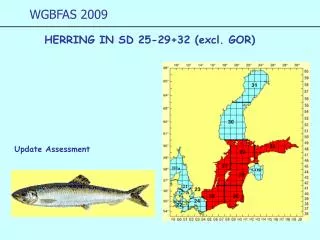
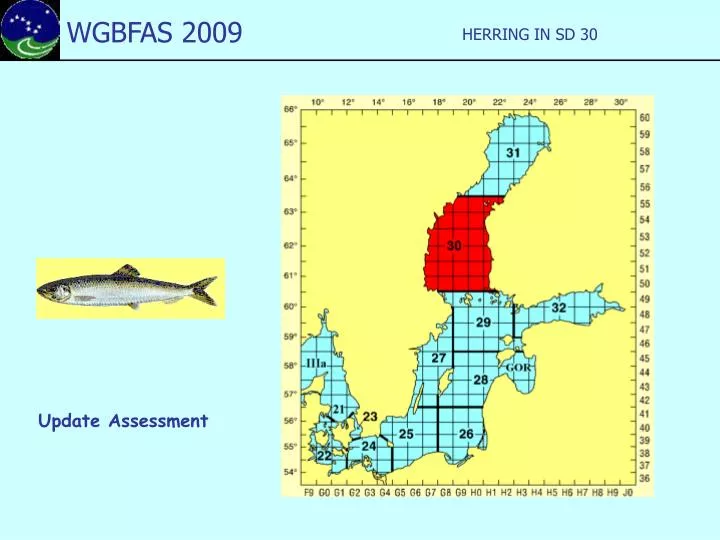
HERRING IN SD 30 WGBFAS 2009 Update Assessment
WGBFAS 2009 HERRING IN SD 30 INPUT DATA Landings: 65 430 t in 2008 (75 432 t in 2007) 94% caught by Finland; 6% by Sweden, Finland: 40% demersal trawl, 54% pelagic trawl, 5% trapnet,<0.2% gillnet Sweden: 47 % pelagic trawls, 23 % gillnet, 30% demersal trawl Unallocated landings: No unallocated landings reported in 2008 Discards: Negligible, not included in the assessment CANUM: Swedish and Finish data combined WECA = WEST: During 1990-ies – decreasing trend MATPROP: constant 1973-1982, since then annual estimates NATMOR: constant = 0.2, exploring predation by seals
WGBFAS 2009 HERRING IN SD 30 Assessment
WGBFAS 2009 HERRING IN SD 30 Assessment
WGBFAS 2009 HERRING IN SD 30 Retrospective
WGBFAS 2009 HERRING IN SD 30 Short term prediction
WGBFAS 2009 HERRING IN SD 30 Short term prediction • Reference points
WGBFAS 2009 HERRING IN SD 30 Short-term implications Outlook for 2010 Basis: F(2009) = Fsq= F(2006-2008) =0.147; SSB(2009) = 474.2; Landings (2009) = 72.4. Weights in ‘000 t. Shaded scenarios are not considered consistent with the precautionary approach. 1) SSB 2011 relative to SSB 2010. Recommendation Fishing below Fpa in 2010 correspond to landings of less than 109.600t