Download
1 / 28
290 likes | 472 Views
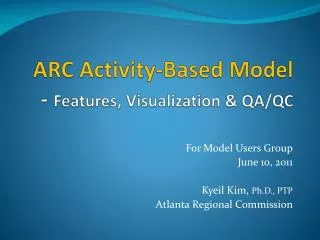
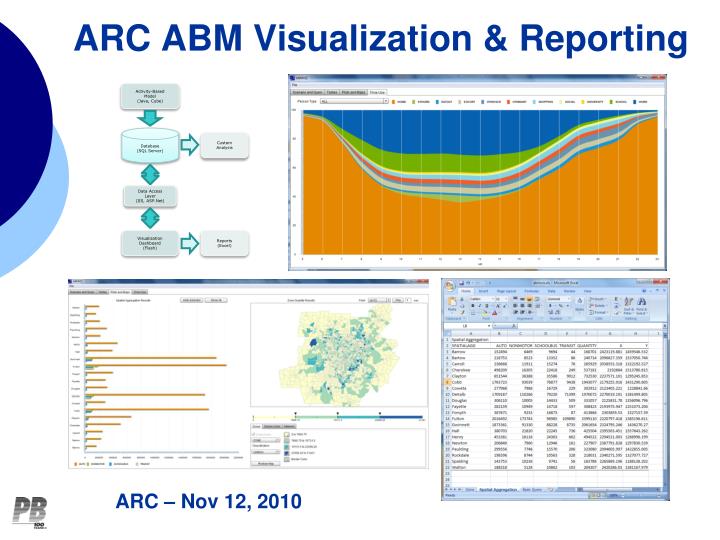
Activity-Based Model (Java, Cube). ARC ABM Visualization & Reporting. Database (SQL Server). Custom Analysis. Data Access Layer (IIS, ASP.Net). Visualization Dashboard (Flash). Reports (Excel). ARC – Nov 12, 2010. Project Need / Goal.

E N D
Activity-Based Model (Java, Cube) ARC ABM Visualization & Reporting Database(SQL Server) Custom Analysis Data Access Layer (IIS, ASP.Net) Visualization Dashboard(Flash) Reports(Excel) ARC – Nov 12, 2010
Project Need / Goal • ABM produces a lot of data, including new types of data, so we need an innovative analysis tool • Develop an ABM visualization and reporting system
We need a system that allows us to… Overview first, zoom and filter, then details-on-demand Shneiderman’s (1996) Visual Information-Seeking Mantra
Required Visuals and Reports • Aggregate summaries • Existing trip-based model summaries (VMT, mode share, boardings, etc) • New summaries (toll markets, time-of-day results, etc) • Geographic summaries • County, Super District, Activity Center, Zone • Dynamic summaries • Maps, charts, animations, etc • Spreadsheets • Automatically create Excel workbooks • Then used by ARC staff for custom analysis • Scenario comparison functionality
Activity-Based Model (Java, Cube) ABM Visualization & Reporting System Database(SQL Server) Custom Analysis Data Access Layer (IIS, ASP.Net) Visualization Dashboard(Flash) Reports(Excel)
Data Preparation • Create De-Normalized Reporting Tables that are FAST and SIMPLE • Add unique IDs for trips • Join tour, HH, person, skim data • Expand joint trips • Add trip start and end information, etc • Implementation Tools • Cube (for exporting data, networks, etc) • Java (as part of CT-RAMP) • SQL • Outputs Loaded into DB • Use BULK INSERT SQL statements
Database • Stores ABM Output Tables, Travel Time Skim Data, and Some Inputs By Scenario • ~8 GBs per scenario • Around 5–10 scenarios at a time in the DB • Can load survey data into DB as a scenario for comparison purposes • Needs to be fast – not a traditional transactional DB, more a data warehouse • Use de-normalized data to avoid millions of joins each time for dynamic visualization dashboard • Read-only; minimal rollback features required • Parallel query functionality (SQL Server) • Needs excellent query caching functionality • Use ARC Enterprise SQL Server with 4 Licensed Processors
Data Access Layer • Thin client to connect dynamic visualization dashboard (Flash) and database (SQL Server) • Use WebORB for .NET to allow Flash to interact with the DB • Fast data communication since data remains in binary form • Flash .NET (C#) SQL Server
Dynamic Visualization Dashboard • Started with ODOT Statewide Integrated Model Visualization Dashboard (SWIMVIZ) • Add additional query capabilities • Add new reports • Excel reports • Add new visuals • Time Use (NY Times) • Activity/Tour Tracing • Radar chart
ABM VIZ – Queries • Lots of default queries • Query builder • Can write custom queries as well
ABM VIZ – Tables • Results for Queries • Results automatically spatially aggregated (to districts, counties, etc) • Save tables to clipboard, Excel
ABM VIZ – Plots and Maps • Default queries automatically visualized • Charts linked to the map • Maps are interactive (zoom in/out, change colors, change color bins, animate changes, etc)
ABM VIZ – Plots and Maps • Can click map zones and run current query • The above shows trip destinations for all SOV Free trips from zones 1-10
ABM VIZ – Plots and Maps • User can change the mapped field in real time as well
ABM VIZ – Plots and Maps • Can click map zones and run current query and generate desire lines (OD information)
ABM VIZ – Plots and Maps • Can draw the network by line width and line color • The above shows PM link volumes by PM V/C ratio
ABM VIZ – Time Use • New time use (person activity over the day) • Can select different person types (the above is showing Full-time workers)
ABM VIZ – Time Use • The above shows Part-time workers
ABM VIZ – Tour Tracing • Can trace tours for individual micro-simulated persons
ABM VIZ – Reports • Copy tables to clipboard • Save tables to Excel • Save queries for reuse • Save maps/plots to file
Conclusions • Database for easier and quicker reporting • Dashboard for real-time model results analysis, debugging, investigation • Platform for innovative ABM visualization • More visuals to come
Questions Ben Stabler, stabler@pbworld.com Joel Freedman, freedman@pbworld.com