Download
1 / 18
180 likes | 285 Views
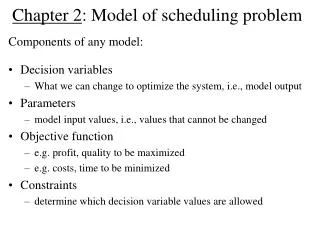
Activity and Cost Analysis of a Scheduling Problem. Terry Weir Joint Operations Division. Outline. Introduction Background Problem Data Regression Analysis Simulations Summary. Introduction. A sample of previous activity and costing studies. References.

E N D
Activity and Cost Analysis of a Scheduling Problem Terry Weir Joint Operations Division
Outline • Introduction • Background • Problem • Data • Regression Analysis • Simulations • Summary
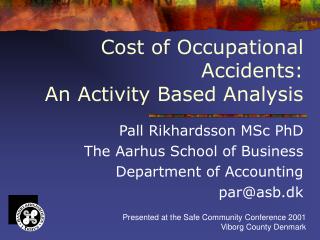
Introduction A sample of previous activity and costing studies
References • Cooper, R., (1988) The rise of activity-based costing – part one: what is an activity-based cost system? Journal of Cost Management, 2, 45-54 • Noreen, E., (1991) Conditions under which activity-based cost systems provide relevant costs, J. Man. Acc. Res, Fall, 159-168 • Willett, R.J. (1987). An axiomatic theory of accounting measurement. Acc. Bus. Res., 17, 155–171 • Willett, R.J. (1988). An axiomatic theory of accounting measurement—part II. Acc. Bus. Res., 19, 79–91 • Colin, A., Lambrineas, P., Weir, T. and Willet, R.J. (2011) Statistical Activity Cost Regression Analysis of a Scheduling Problem, in J. Mathew et al. (eds.), Engineering Asset Management and Infrastructure Sustainability, pp 121-131, Springer-Verlag London Limited • Amadi-Echendu , J., Willett, R. J., Brown, K., Matthew, J., Vyas, N. and Yang, B-S. (2010) What Is Engineering Asset Management? In Amadi-Eschendu et al. (eds) Engineering Asset Management Review 1, Definitions, concepts and scope of engineering asset management pp 3-16, Springer-Verlag London Limited.
Background to this study • Traditional cost accounting • Costs allocated to products based on volume of product or output • Simple to use • Little computing power needed • Activity based costing (see eg Cooper 1988) • Activities generate costs • Two stage allocation • Activities • Products or outputs • Greater segmentation of costs & fidelity • Higher computation requirements • Questions over appropriateness of activities • Conditions for accuracy and cost separation are very strong (Noreen 1991) • Both methods suffer from arbitrary allocations • and assume recorded costs are deterministic
Background • Statistical Activity Cost Analysis (Willett 1987, 1988) • Axiomatic model addresses: • Transaction costs • Continuity of production relations • Separability of production relations C Asset at t-1 Equity at t a0 Activity Costs Asset at t a2 Asset at t-1 Asset at t a1 t -1 t R. Willet 2004 time t Can recover all accounting arithmetic Costs are random variables Application to earnings, depreciation and goodwill Application to reliability analysis, portfolio budgeting and scheduling
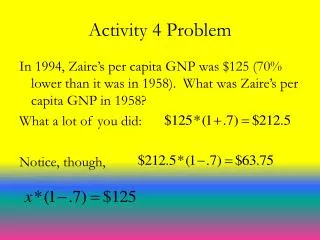
Problem – can we relate Navy fleet activities to costs A key question in Defence planning is “how much does it cost to conduct an exercise, event or activity?” Our question is can the cost of activities be estimated, based on a knowledge of past activity levels? If we can do this this we can use this to better estimate costs for budgeting, risk analysis etc By product : better preparedness management Typical costing approaches tend to be subjective and deterministic. We aim for a statistical approach.
Data Navy Activities FAMT provides data for the ‘activity’ dimension Fleet activities generate Navy outputs Activity data can be described by multiple parameters: duration, type, location, operation….
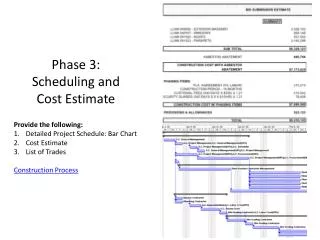
DataCosts • Data sourced from Defence ERP systems ROMAN, JFL, SDSS/MILIS, COMSARM, PMKEYS, ADFPAY, CENRESPAY • Consolidated in Navy’s Activity Based Management System • Costs categorised by ship class and expense type • Costs aggregated by quarter
Sample Data • 4 platforms, P1..P4, same class, 6 cost categories, direct costs only, 26 quarters Average cost per quarter $7.59m Standard deviation per quarter $1.39m
Observed correlations Cost M I ? E F P O ? Cost
Regression • When durations of events are included: • No simple contemporaneous relationship between costs and events in current time periods • But if lags are considered, a systematic pattern emerges • Simple model: Yi,t are the costs in each category Ai,tare the away from home port times ai are the fixed costs bi,t are prices of variable away times Current costs depend on past activities! This is not what is expected from ABC!
Forecast power • Fuel, expenses, personnel and maintenance costs have significant two period lags • Ordnance and inventory costs have lags of either one or three periods • The strengths of the lags is surprising. We would expect contemporaneous associations between cost changes and underlying activities • Possible explanations: • Activities are related over time causing costs to be incurred eg maintenance and operational schedules – future maintenance costs depends on past activities • Accounting systems produce lags because of invoice processing etc
Forecast power • More advanced model • Costs as a function of alongside time, at sea time, maintenance time • Again statistically significant lagged relationships • But the improvement is not remarkable • Simply adding more data does not necessarily improve forecast power
Simulations • SACA is based upon the objective of providing an improved description of the relationships between physical processes and financial measurements. • In this it is similar to activity based costing. • SACA integrates statistical theory into the analysis of these relationships. • If alternate attributes such as capability or risk measures can be related to physical tasks, then we can model the interaction of costs, capability and risk
Example Simple Simulation Simulated Maintenance and Away Periods Ships P1 • We assume ‘Capability’ is a decaying function of time from last major maintenance. Capability is refreshed in maintenance • The simulator generates events • Maintenance periods are quarterly or biannual • Platform activities are uniformly distributed over a six month period beginning with the start of maintenance • The duration of maintenance periods are randomly generated from a beta distribution • Platform activities arrive randomly conditional upon their planned maintenance; non-zero probabilities of multiple platforms in maintenance simultaneously • Costs are generated using the away times generated by the maintenance schedules • Overall fleet capability is measured on a daily basis by averaging individual daily capability P2 P3 P4 Time Beta Distribution
Summary & Conclusions • Good results exhibit potential to use SACA in modelling cost and activity data • The model demonstrated here has a fixed and variable component. Better understanding of ‘cost drivers’ will enable models to eliminate lags as much as possible • Capability and capacity metrics can be utilised in simulations based on SACA • Automation of data capture etc should allow for decision support tools • Direct applicability to cost generation in FAMT