Download
1 / 38
380 likes | 526 Views
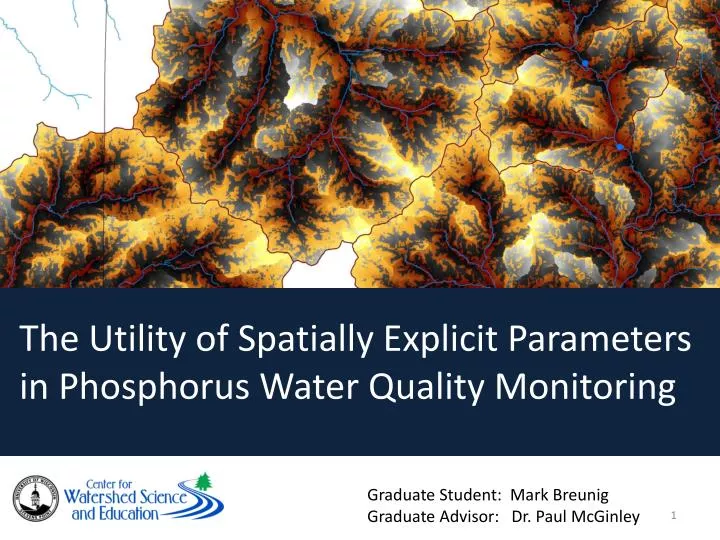
The Utility of Spatially Explicit Parameters in Phosphorus Water Quality Monitoring. Graduate Student: Mark Breunig Graduate Advisor: Dr. Paul McGinley. PRESENTATION OVERVIEW. Background Information Objectives Methods Discussion. PRESENTATION OVERVIEW. Background Information

E N D
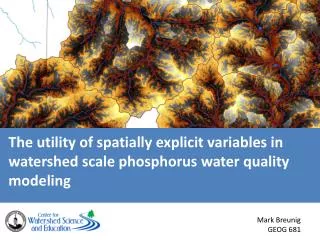
The Utility of Spatially Explicit Parameters in Phosphorus Water Quality Monitoring Graduate Student: Mark Breunig Graduate Advisor: Dr. Paul McGinley
PRESENTATION OVERVIEW Background Information Objectives Methods Discussion
PRESENTATION OVERVIEW Background Information Objectives Methods Discussion
PHOSPHORUS Eutrophication …Models, Legislation
R2 = 43% p < 0.001 2001 – 157 sites 2002 – 78 sites 2003 – 5 sites Total: 240 sites
PHOSPHORUS Although efforts are underway to set stream standards in Wisconsin and elsewhere, there is still controversy regarding the mechanisms that control stream phosphorous concentrations. This represents a collective misunderstanding of the fundamental processes that control water quality at the catchment scale (Boomer et al. 2008).
spatially explicit… WHAT?
spatially explicit parameters… the location of landscape features within a watershed is significant -why?- flow path characteristics are a “driving factor” in this process
flow path characteristics surface overland flow only • distance • time • topography • connectivity • run-on – cumulative effects?
PRESENTATION OVERVIEW Background Information Objectives Methods Discussion
Objectives • Derive spatially explicit parameters • Demonstrate the utility of spatially explicit parameters
PRESENTATION OVERVIEW Background Information Objectives Methods Discussion
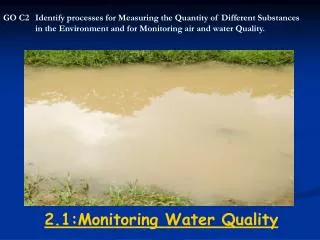
Methods Asses the utility of spatial parameters by… • attempting to improve explained variation in observed data set • observed data set => over 200 sites across Wisconsin • wade-able streams • fixed monthly summer sampling • Source: USGS
R2 = 43% p < 0.001 2001 – 157 sites 2002 – 78 sites 2003 – 5 sites Total: 240 sites
Methods Details of data management • 30m DEM - USGS • 30m 2001 NALCD – USGS • SSURGO (feature) – NRCS • Robertson Watersheds • Sampling Locations • Raw Data – Water Quality Results
Methods Details of data management OPERATION SSURGO Visual Basic/Arc Objects: For each county in Wisconsin 1.Query SSURGO database 2.Export query results as table 3.Join table to shapefile 4.Shapefile to 30m raster Next
Methods Details of data management OPERATION FLOWPATH Visual Basic/Arc Objects: For each pixel in watershed Calculate spatially explicit metric along flowpath Next
PRESENTATION OVERVIEW Background Information Objectives Methods Discussion
Pixel Value (proportion – no units) Σ(eFLag* β) Σ(eFLall* β)
Potential Barriers In Recognizing Signal • SPATIAL SCALE • TEMPORAL SCALE • MATHMATICS • WATER QUALITY METRIC • BOUNDARY DELINEATION • RANDOMNESS
s Field-Scale vs. Basin-Scale Do remotely sensed basin-scale observations adequately represent surface overland flow paths? *snap plus *micro-topology …sometimes
Resolution Is 30m resolution enough? pixel
Properly Considering Time Is it appropriate to model surface overland flow path characteristics as a “long-term annual average” or must the time step be smaller? *wet years/dry years *variations in rainfall distribution *hour/minute time step– saturated areas
SUMMARY STATISTICS What is the best way of summarizing flow path characteristics for thousands of pixels – measures of central tendency?
27% of “Watershed” not contributing but… % LU changes only 1% RANDOM SPATIAL CONFIGURATION?
HYDROLOGIC CONNECTIVITY Can the utility of spatially explicit parameters be demonstrated without accurately modeling hydrologic connectivity?
…Continued efforts generate a suite of spatially explicit parameters test utility of parameters
The Utility of Spatially Explicit Parameters in Phosphorus Water Quality Monitoring Graduate Student: Mark Breunig Graduate Advisor: Dr. Paul McGinley