Download
1 / 38
430 likes | 732 Views
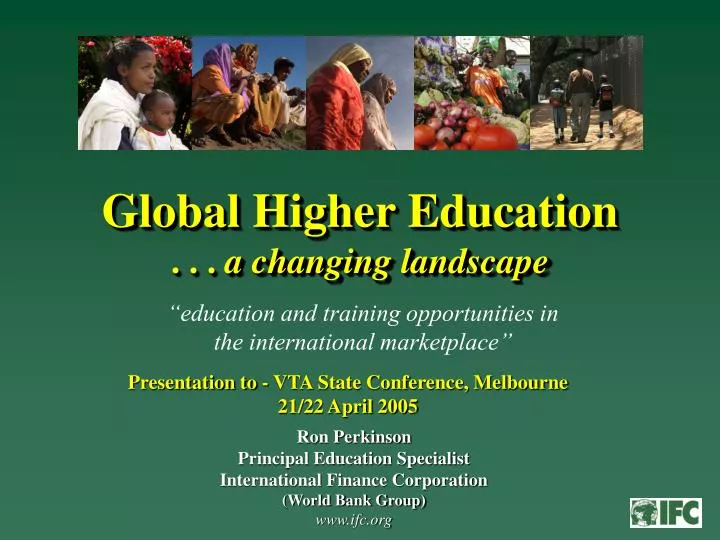
Global Higher Education . . . a changing landscape. Ron Perkinson Principal Education Specialist International Finance Corporation (World Bank Group) www.ifc.org. “education and training opportunities in the international marketplace”.

E N D
Global Higher Education . . . a changing landscape Ron Perkinson Principal Education Specialist International Finance Corporation (World Bank Group) www.ifc.org “education and training opportunities in the international marketplace” Presentation to - VTA State Conference, Melbourne 21/22 April 2005
The Global Education Market • Total $2.3 trillion+– approx one third of market in USA – around 15% only in the developing world • Teachers – 5% of global labor force • Primary & Secondary Education– substantially public funded • Tertiary & Adult Education– changing landscape - free provision disappearing – regulatory - governments more liberalized – private sector participation growing Sources: Merrill Lynch 2000; OECD 2002; World Bank; IFC:
Higher Education Worldwide • Yr 2000 – there were over 90 million students enrolled in higher education worldwide • By 2003 est. over 100 million students worldwide – approx 4 m of the 11%+ inc. was in China alone – around 2 m increase in India the same period • The Private higher education market is estimated to be worth more than $300 billion worldwide on current expenditures alone – and growing Sources: Merryl Lynch 2000; IFC staff estimates; World Bank
Higher Education – ‘the perfect storm’. . . the seven converging forces of change • The increasing importance of knowledge • The change in demographics • Decline in public financing – sourcing alternative financing • The further impact of globalization • The impact of increasing competition • The continued impact of internationalization • The continuing Information & Communications Technologies revolution Source: ‘World Bank ‘Constructing Knowledge Economies” 2002; The Changing Enterprise’ – ACE 2002; International Finance Corporation
World Population Growth Source: “6 Billion Human Beings:” - Musée de l'Homme Muséum National d'Histoire Naturelle, Paris –France; * = World Bank/ IFC
Category - Fiscal Year By Education Level Percent 63 - 69 70 - 79 80 - 89 90 - 99 00 - 02 Primary Education 2 13 19 38 50 Secondary Education 52 19 8 15 15 Vocational post-secondary education 24 33 27 9 7 Tertiary education including teacher training 20 30 43 25 15 Other education * 2 5 3 13 13 World Bank Group 4 decades of education lending 65% 22% * = Projects supporting more than one level of education or projects such as those supporting lifelong learning that do not fit well into one of the other categories
Average 12% ’03 to ‘05 Between 2003 to 2005 – the % of lending for higher education declines further
Funding Comparatives. . . the most populous examples Sources: UNESCO 1999 & 2000; World Bank 2001; US Department of Education 2001; Department of Education & Skills UK, 2002; China National Center for Education, 2002/3; OECD 2002 * All Sth & East Asian countries without China & India
Public Spending on Tertiary Ed, % Total Public Spending on Education Public Spending per Tertiary Student Tertiary Education in Biggest 40 Developing Countries OECD $7,712 2001 $618 Sources: World Bank Development Indicators; World Bank Edstats; UNESCO Global Education Digest; OECD Education at a Glance; IFC calculations *Developing 40 includes: Angola, Argentina, Bangladesh, Bolivia, Brazil, Bulgaria, Cambodia, Chile, China,Colombia, Dominican Republic, Ecuador, Egypt, Ghana, Guatemala, Hungary, India, Indonesia, Jamaica, Jordan, Kenya, Madagascar, Malaysia, Mauritius, Mexico, Mozambique, Pakistan, Peru, Philippines, Poland, Romania, Russia, Senegal, South Africa, Thailand, Trinidad & Tobago, Turkey, Uganda, Uruguay, and Vietnam Note: All amounts are in constant 1995 US$ Values
Developing Asia’s Global Peers* Enrollments – Tertiary Sector Sources: World Bank Development Indicators; World Bank Edstats; UNESCO Global Education Digest; OECD Education at a Glance; IFC calculations **Developing Asia includes: Bangladesh, China, India, Indonesia, Malaysia, Philippines, Thailand, and Vietnam *32 Developing Country Sample includes: Angola, Argentina, Bolivia, Brazil, Bulgaria,Chile,Colombia, Dominican Republic, Ecuador, Egypt, Ghana, Guatemala, Hungary, Jamaica, Jordan, Kenya, Madagascar, Mauritius, Mexico, Mozambique, Pakistan, Peru,Poland, Romania, Russia, Senegal, South Africa, Trinidad & Tobago, Turkey, Uganda, and Uruguay
Developing Asia’s Global Peers* OECD $7,712 2001 OECD $5,737 1990 34% increase $1,067 $899 16% decrease $405 46% increase $278 Sources: World Bank Development Indicators; World Bank Edstats; UNESCO Global Education Digest; OECD Education at a Glance; IFC calculations **Developing Asia includes: Bangladesh, China, India, Indonesia, Malaysia, Philippines, Thailand, and Vietnam Spending Per Student – Tertiary Sector *Developing Asia’s Global Peers include: Angola, Argentina, Bolivia, Brazil, Bulgaria,Chile,Colombia, Dominican Republic, Ecuador, Egypt, Ghana, Guatemala, Hungary, Jamaica, Jordan, Kenya, Madagascar, Mauritius, Mexico, Mozambique, Pakistan, Peru,Poland, Romania, Russia, Senegal, South Africa, Trinidad & Tobago, Turkey, Uganda, and Uruguay
Enrollment in Private Higher Education (as a % of total) Sources: EdStats, World Bank; IFC; OECD; Various Government Statistics; Chile includes 7 publicly funded Private Catholic Universities;
Knowledge Drives Economic Development . . . important impact comes from skills literacy • Knowledge is an all important driver of economic development • Not just about putting more highly qualified people in to higher paying jobs • Proven impact on economic development comes from increasing skills literacy – mid & higher level skills are not just about degrees – indications show quite the opposite (University of British Colombia ‘Literacy Survey’) • New skills training & knowledge dissemination of economic relevance need to reach larger firms, private sector, SME’s, micro-enterprise, individuals and the unemployed – reach traditional sectors (agriculture, small manufacturing, services, crafts, tourism, etc) – to help economies be more productive and competitive • More highly skilled workforce isn’t just for big firms and government • Need to turn country’s human resources into strategic advantage Source: University of British Columbia – ‘Literacy Survey – Ana Ferrer, David A. Green, and W. Craig Riddell - The International Adult Literacy Survey’ (IALS) was a 22-country initiative conducted between 1994 and 1998. http://www.statcan.ca/english/research/89-552-MIE/89-552-MIE2004012.pdf
Lifelong Learning Changing Student Profiles • Adults with tertiary qualifications – increased from 22% to 41% over last 25 years in OECD countries • Over 40% of undergraduates in US & 30% of Canada’s undergraduate students are over 25 yrs • Yr 2000 – over 20% of first year university students were over 27 yrs – in Australia, NZ, Denmark, Norway & Sweden • Lifelong learning attracting new learners – more diversified – older and part time students Sources: OECD 2000; ‘The Changing Enterprise’ – ACE 2002;
Lifelong Learning • Developing a Lifelong Learning Framework – • Requires fundamental changes to the education system • HEI’s need to adapt – change Missions, pedagogical processes, accommodate different learning models (formal education / on-the-job training / at home learners) • The role of technology – can expand access and change the nature of learning – facilitating new modes of delivery (e.g. distance / online learning); and mixed modes • The framework will accommodate the constant updating of skills, to develop a highly qualified and flexible labor force with new sets of skills and competencies • Becoming increasingly important in Asian markets
Cross Border Investment HEI Campuses In Foreign Countries • Since Yr 2000: • Laureate (previously Sylvan International Universities) invested in Spain, France, Switzerland, Mexico, Chile, Ecuador, Panama, Costa Rica, Peru – and looking elsewhere; • Apollo International invested in Mexico, India, Holland, Brazil; • University of Nottingham & CIBT/Apollo in China; • RMIT in Vietnam; • Monash in South Africa; • Universitas 21 in Singapore; • Manipal in Nepal and Malaysia Sources: Chronicle June 2003; Company 10-K Reports; IFC 2004
UK – recent foreign campus examples in China University of Nottingham – first foreign HEI to open a campus in China (Sept 2004) – same degrees awarded – sit same exams – foreign/cultural & language immersion alternatives – over 50% UK academic involvement – improving internationalization Napier University of Edinburgh– NU opening an international franchise campus on Zhengzhou University of Light Industry, Henan Province, China – Chinese students study for Scottish degree in China – Now exploring potential for undergraduate and postgraduate exchange programs, as well as research Sources: The Scotsman – 1st October 2004; Business China 14 March 2005; IFC 2005
Students Studying Abroad • Yr 2000 - >1.6 million international tertiary students abroad in OECD countries alone – over 2 million across the world – estimate 8 million students by 2025 • In 2004 USA dropped to 576,000 – or about 35% of OECD total – UK (14%) – Australia (13%) – Germany (12%) – France ( 8% ) – NZ ( 5% ) – most from developing countries – Chinese students – Australia (+43% last year) & NZ (60% of total univ) • China – > 60,000 foreign students in 2002 – of which approx 70% from Asia – 12% from Europe – 11% from the USA – & growing • Russia – In 2001, 90,000 students – 40,000 from CIS countries – around 100,000 today • Malaysia – 37,000 students today Sources: OECD 2000, 2002; AUSTRADE 2003; NZ Trade 2003; China Education Yearbook, 2002; Education World 2003; Malaysia MoE 2004
International Students – Big Business • Australia – 210,000+ foreign students in Yr 2003 - with 18,000 in off-shore VET, in 24 countries - more than 50% were located in China – predicting 560,000 foreign students by 2025 – double again in distance programs • % of Service Exports – 13% and 8% respectively of Australia and NZ’s in Yr 2003 – 4.2% and 3.2%* respectively of US and UK’s Sources: OECD; IFC; World Bank; Report commissioned by IDP Education Australia; AIEA Fact Sheet & NCVER Australia 2005; China Education Yearbook, 2002; World Bank – Bashir 2005; * = last figure Yr 2000
But the trends are changing - 1 • In 2003 Australia became second most expensive country to study in after the UK, with tuition costs more than doubling since 2001 • Annual living costs for students in popular English speaking countries - UK (US$11,152); Australia (US$9,519); Canada and US (just under US$9,000); NZ (US$8,686) • Competition increasing from Asian countries – Hong Kong (US$7,081); India (US$1,515) • Australia impacted by Aus $ FOREX increase – plus 12% pa inc in tuition fees and living expenses – plus other factors Sources: “Comparative Costs of Higher Education for International Students 2004” – IDP, Australia
But the trends are changing - 2 China • Record 20 million students enrolled in Chinese colleges in 2004 – the largest college-student population in the world • 4.2 million freshmen accepted - double the number of 1998 • College acceptance rate this year was about 60% • University & TVET students see growing attractiveness to study at home - Less Visa complications • Growing two-way relationships with foreign partners Singapore – 170 private tertiary providers with 119,000 students – 75% of them study in foreign joint/affiliate programs – 35% were over 30yrs – 30% were 25yrs to 29 yrs – most were lifelong learners Sources: Business China 14 March 2005; IFC 2005
But the trends are changing - 3 • British universities also rely heavily on the Chinese market • In 2004 overseas students grew to around 200,000, bringing in over £1.25 billion or $2.4billion in fees • International student numbers fell by 5.3% in 2005 • China made up 25% of UK 2004 international student numbers • UK feedback - Reasons for changing trends in China include: – the perceived improvement of institutional quality in China - more appealing to study at home – the Chinese labor market no longer putting such a large premium on foreign degrees – local and foreign qualifications, joint foreign degrees and local work experience count for greater employability – ‘Certified’ training and LL/Lng programs growing in appeal • In 2005 British HEI’s have around 160 joint program affiliations with Chinese HEI’s, with many more planned Source: Economist - March 2005; IFC
China’s Learning Needs Beyond Formal Education Beyond Retirement Age Training for the unemployed Remedial/ Updating/ Upskilling the Participating Workforce Labour Force (750m) Adult learners Higher Ed Government Failure – students out of school Formal Education (244m) Secondary Basic Education
International student preferences and destinations are changing • Greater competition from LAC, EU, Central America • Partial international study can satisfy cultural immersion needs • Universities used to hold the high ground – new systems of education, training and lifelong learning are demanding programs of greater economic relevance – both university and non-university tertiary – the educational, social and commercial gains from University / TAFE partnerships in cross border trade in education services are yet to be optimized
And – are ‘AID’ and ‘TRADE’ talking to each other? • AID needs TRADE in selected projects to convert Technical Assistance in to downstream sustainability • TRADE in some cases can leverage alternative downstream resources that governments can no longer afford to carry
Demand For Greater Program Diversity • Employers in region requiring educational credentials or ‘certified’ training – important for job market • Employers seeking greater flexibility of program choice – want training and job preparation for jobs that exist and improved competencies for career enhancement Typical local career providers can include – • Professional schools – accounting, language • Business schools • Engineering schools • Training in ICT’s – low / med / high-end technologies • Industry schools (tourism; agri-business; forestry; fishing; etc)
Local Context Is All Important • What is the role of government – enabler or controller? • Local education policy objectives – and what is the effectiveness of local policies and frameworks • Adequacy of student financial support • Understanding of economic and social development • – demand for fee-paying programs – demand, supply & gaps in public provision – relevance of current programs – needs of traditional sectors • Historic educational traditions, social & cultural values – or in past political ideology (Africa, CEE, India)
Changing Business Models • Changing modus operandi – Public goes Commercial / Private – new forms of competition • Shift from ‘venue-driven’ to ‘market-driven’ delivery systems • Market demand for flexible delivery options (evenings; weekends; distance learning; use of new learning technologies) • The campus-based to web-based ‘Continuum,’ is changing models – academic and investment confidence in e-learning is growing • From isolated university models – to linked HEI courses – QA and credit transfer systems – broader options and career pathways • Separation of institutional management and academic power of faculty – different control over ‘business administration’
Distance Education • Tertiary distance education – fastest growing sub-sector – represents at least 15% of all higher educations students • Asia has 3.5 m students (2000) • 30% of all tertiary courses in Russia are distance • LAC has over 1 million tertiary distance education students • E.A.D.T.U. – 18 members – 14 countries – > 900,000 students • British Open University with over 154,000 students – also delivers in to developing countries • Australia – over 50% of foreign students enrolled on Australian campuses from Singapore and Hong Kong, are distance Source: ‘The Changing Enterprise’ – ACE 2002; World Bank & IFC; IDP Education Australia 2002
On-Line Education – steady growth • Yr 2002, 19% of corporate training in US was on-line – up from around 7% three years earlier – est $150 billion industry by 2025 – major growth predicted in developing countries • Estimate approaching 1m students on-line in China • Tec de Monterrey has over 100,000 students – Universidad Virtual has >80,000 doing part or all courses on-line – over 5,000 outside of Mexico • In the US - 1.9 million students studying on-line in 2003 – 2.6 million students (16% over all) in 2004, or 24% increase. Approx 40% of these are fully on-line (18% inc) Sources: IDC; IFC; Tec de Monterrey 2003; World Bank / AVU 2003; Sloan Consortium 2004
120,000 100,000 80000 60000 40000 20000 0 1999 2000 2001 2002 2003 2004 University of Phoenix On-Line Enrollment Growth 109,800 79,400 49400 29000 18000 10,000 Source: Chronicle Nov 2002; Charles Schwab Sept 15th 2004
Cross border education opportunities Internationalization provides easy and low risk stepping-off point – for customizing and disseminating new types of knowledge and skills – program partnerships - for improving curriculum content, development & research – opportunities for student and faculty exchange – plus joint programs that accommodate cultural immersion – adding value by facilitating transferability of credits and qualifications (Are the advantages of having a qualifications framework at home, being optimized?) – Internationalization can lead to other commercial initiatives
PPP Example - Blended Campus/On-line Joint Degree Stevens Institute of Technology - China Hybrid Program • 1/3 taught online by Stevens faculty / 1/3 taught by Chinese faculty using Stevens curriculum / 1/3 taught by Stevens faculty onsite in Beijing • Tuition - Revenues split 50-50 between schools • Chinese pay for classrooms, Chinese faculty, local software and workstations • Stevens pays for Stevens faculty, travel, housing • Stevens is university of record & holds student transcripts and history • Chinese manage classrooms, logistics and Ministry of Education Partner Institutions in China • Beijing Institute of Technology; Shanghai Jiao Tong University; Central University of Finance & Economics
For International Consulting . . . • Local governments are World Bank ‘clients’ • Local market will hold the greatest power and influence when deciding who to use – so it bodes well for those that Internationalize and get on the ground first! • Decision making – local experience is important – Internationalization and program affiliations the quickest way to obtain local experience & support • Private higher education providers – not to be underestimated – tend to respond more quickly to joint initiatives – strong reputations for quality & relevance of local programs, with high employability of graduates • Use of donor/ grant/ trust funds – to assist with positioning • Promote successes – publish case studies
Future Outlook Financingof education will tighten – demographics outweigh fiscal realities – growth in non-public financing New business models – ‘Public going Private’ trend will grow Knowledge societiesandlifelong learning – important for economic development – more flexible mass & e-delivery – new systems for education and training Globalization and Internationalization – changing the future landscape of higher education, national and cross-border – transferability of credits & qualifications, national & foreign – optimizing Education/AID/Trade efforts & investments essential ICT’s and the Internet – optimizing use of new technologies – models advancing quality-based mass education delivery
There is nothing permanent . . . except change! Heraclitus