Download
1 / 31
310 likes | 605 Views
Work Zone Operations. MO/KS Chapter, ACPA 20 th Annual P.C. Concrete Paving Conference Kansas City, Missouri March 8-9, 2000 Phillip Ditzler, P.E. Work Zone Operations Team Leader FHWA, Office of Transportation Operations Washington, D.C. Presentation Overview.

E N D
Work Zone Operations MO/KS Chapter, ACPA 20th Annual P.C. Concrete Paving Conference Kansas City, Missouri March 8-9, 2000 Phillip Ditzler, P.E. Work Zone Operations Team Leader FHWA, Office of Transportation Operations Washington, D.C.
Presentation Overview • FHWA Headquarters Organizational Structure • Background • “Meeting the Customer’s Needs for Mobility and Safety During Construction and Maintenance Operations” • Current Activities
Headquarters Restructuring POLICY ADMINISTRATION RD&T PROFESSIONALDEVELOPMENT CORPORATEMANAGEMENT CIVILRIGHTS PUBLICAFFAIRS COUNSEL Service Units Core Business Units (CBUs) ITS JPO Operations Federal Lands Highway Environment & Planning Infrastructure PRODUCT TEAMS Safety
OPERATIONS CBU Operations Program Manager / Director, ITS JPO ITS Joint Program Office Office of Operations Technology Services Office of Transportation Operations Office of Travel Management Office of Freight Management & Operations
Office ofTransportation Operations • Work Zone Operations • Weather & Winter Mobility • MUTCD • Emergency Preparedness
Q. What’s the public’s biggest complaint? A. The lane is closed and there’s no work going on!
“It is the sense of Congress that many highway projects are carried out in a way which unnecessarily disrupts traffic flow during construction and that methods need to be adopted to eliminate or reduce these disruptions.” Section 1090 ISTEA
NQI Survey • Only 29% of respondents were satisfied with traffic flow through Work Zones • The other 71% weren’t!
Safety WZ Fatalities/Injuries (1998) • 772 fatalities * • 114 non-motorist * • 37,000+ injuries * NHTSA’s FARS data
WZ Crashes • Majority occur: • Beginning of the queue • In the transition zone • Caused by: • Excessive speed • Driver inattention
Delay in WZs • Motorist • No quantifiable statistics on an areawide or statewide basis • Economic losses • No quantified data on a national or regional basis
“To the public the worst thing is being delayed. The second worst thing is not knowing why they’re being delayed.” … State DOT Executive
The Public Wants Us To Get In! Do It Right! Get Out! Stay Out!
National Challenge • 40% Increase in funding w/ TEA-21 • Congestion will increase by 50% in 10 years • Aging highway system • Public demanding virtually unlimited mobility
“Meeting the Customer’s Needs for Mobility & Safety During Construction & Maintenance Operations”
= States visited Organizations Scanned • 26 State DOTs • 4 Cities • 2 Counties • 7 Contractor Associations • 3 Equipment Manufacturers • 5 Toll Authorities • Others (State Police, GHSRs, AAA, Trucking Associations, etc.)
Report Presents • State of the practice • State of the art • Model traffic management program • Benchmark our future actions • Best practices/policies (250+) • Menu of practical measures
11 Categories of Best Practices/Policies • Policy and Procedures • Public Relations, Education, & Outreach • Prediction Modeling and Impact Analysis: Congestion & Crashes • Planning & Programming
11 Categories of Best Practices/Policies • Project Development & Design • Contracting and Bidding Procedures • Specifications & Construction Materials, Methods & Practices
11 Categories of Best Practices/Policies • Traveler & Traffic Information • Enforcement • ITS & Innovative Technologies • Evaluation and Feedback
Role of FHWA • Research • Technology Sharing • Education • Continuous Quality Improvement • Partnerships • Standardization
FHWA’s Vision “NO DELAYS OR CRASHES IN WORK ZONES”
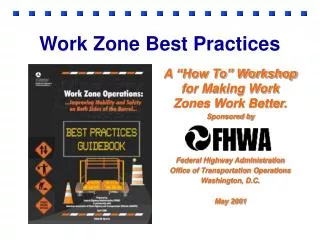
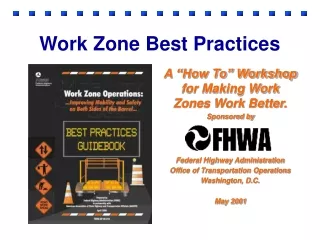
Current Activities • Best Practices Guidebook • Self Evaluation Guide • National Work Zone Safety Awareness Week • Decision Making Tools
Best Practices Guidebook • In partnership with AASHTO • A collection of highway community best practices used for improving mobility and safety through work zones • Create a “living” document
Self Evaluation Guide • Allows assessment of the traffic management process/program • A measuring tool - easy & ready to use • Framework for discussion • Encouraging Division and State DOT’s to jointly partake in the evaluation
National Work Zone Safety Awareness Week • Increase the public’s awareness of work zone safety • April 3-7, 2000 • Partnering with industry & government • Promote a common set of safety tips • Emphasize the value of training – worker & motorist • Share industry best practices
Decision Making Tools • Evaluate strategies against each other • Perform traffic impact analysis and delay estimations • Economic analysis • Real time monitoring and traffic management through the work zone
Partnership • Industry • State DOTs • FHWA • Public
More Information Main Report www.fhwa.dot.gov/reports/bestprac.pdf 250+ Best Practices www.fhwa.dot.gov/quality/bestprac2.htm National Work Zone Safety Information Clearinghouse http://wzsafety.tamu.edu or Ph. 1-888-447-5556