Download

1 / 48
480 likes | 588 Views
Spectroscopy “seeing the unseeable”. Color. 400. 500. 600. 700. 800. “color wheel”. b -carotene. l max is at 455 – in the far blue region of the spectrum – this is absorbed The remaining light has the complementary color of orange. electromagnetic relationships:

E N D
Spectroscopy “seeing the unseeable”
Color 400 500 600 700 800
b-carotene lmax is at 455 – in the far blue region of the spectrum – this is absorbed The remaining light has the complementary color of orange
electromagnetic relationships: λυ = c λ µ 1/υ E = hυ E µ υ E = hc/λ E µ 1/λ λ = wave length υ = frequency c = speed of light E = kinetic energy h = Planck’s constant λ c
Two oscillators will strongly interact when their energies are equal. E1 = E2 λ1 = λ2 υ1 = υ2 If the energies are different, they will not strongly interact! We can use electromagnetic radiation to probe atoms and molecules to find what energies they contain.
Spectroscopy The higher energy ultraviolet and visible wavelengths affect the energy levels of the outer electrons. Infrared radiation is absorbed by matter resulting in rotation and/or vibration of molecules. Radio waves are used in nuclear magnetic Resonance and affect the spin of nuclei in a magnetic field.
Energy Level Diagram for an Atom of Sodium E2 ENERGY E1 330 nm 590 nm E0 Ground State
Energy Level Diagram for a Simple Molecule E2 Relaxation from the E2 energy state to E0 may go to different vibrational energy states, emitting different wavelengths. E1 ENERGY Excitation to the next electronic energy level caused by adsorption of specific wavelengths e4 e3 e2 e1 Vibrational Energy Levels E0 Ground State
LUMO: Lowest Unoccupied Molecular OrbitalHOMO: Highest Occupied Molecular Orbital
UV/VIS SPECTROSCOPY Visible (380-780 nanometers) Ultraviolet (UV) (10 – 380 nanometers). Below about 200 nm, air absorbs the UV light and instruments must be operated under a vacuum
Instrumentation • Deuterium lamp – covers the UV – 200-330 • Tungsten lamp – covers 330-700 log(I0/I) = A I0 I UV-VIS sources sample 200 700 l, nm detector monochromator/ beam splitter optics I0 I0 reference
UV Spectroscopy_DAD • A recent improvement is the diode-array spectrophotometer - here a prism (dispersion device) breaks apart the full spectrum transmitted through the sample • Each individual band of UV is detected by a individual diodes on a silicon wafer simultaneously – the obvious limitation is the size of the diode, so some loss of resolution over traditional instruments is observed Diode array UV-VIS sources sample Polychromator – entrance slit and dispersion device
UV Spectroscopy • Only quartz is transparent in the full 200-700 nm range; plastic and glass are only suitable for visible spectra • Concentration is empirically determined • A typical sample cell (commonly called a cuvette):
Example of a Method to Determine the Absorption Spectra of an Organic Compound Woodward’s Rules For Conjugated Carbonyl Compounds Aldehyde: 208 nm Extended conjugation: 30 nm Homodiene component: 39 nm a-Alkyl groups or ring residues: 10 nm d-Alkyl groups or ring residues: 18 nm Calculated: 304 nm
OTHER CONCEPTS IMPORTANT TO UV/VIS SPECTROSCOPY • UV/Vis spectra can be used to some extent for compound identification, however, many compounds have similar spectra. • Solvents can cause a shift in the absorbed wavelengths. Therefore, the same solvent must be used when comparing absorbance spectra for identification purposes. • Many inorganic species also absorb energy in the UV/Vis region of the spectrum.
UV Spectroscopy • Solvents must be transparent in the region to be observed; the wavelength where a solvent is no longer transparent is referred to as the cutoff • Since spectra are only obtained up to 200 nm, solvents typically only need to lack conjugated p systems or carbonyls • Common solvents and cutoffs: • acetonitrile 190 • chloroform 240 • cyclohexane 195 • 1,4-dioxane 215 • 95% ethanol 205 • n-hexane 201 • methanol 205 • isooctane 195 • water 190
UV Spectroscopy • Aromatic Compounds • When the number of fused aromatic rings increases, the l for the primary and secondary bands also increase • For heteroaromatic systems spectra become complex with the addition of the n p* transition and ring size effects and are unique to each case
279nm 259nm 278nm
Infrared radiation λ = 2.5 to 17 μm υ = 4000 to 600 cm-1 These frequencies match the frequencies of covalent bond stretching and bending vibrations. Infrared spectroscopy can be used to find out about covalent bonds in molecules. IR is used to tell: 1. what type of bonds are present 2. some structural information
Absorption Frequencies of Functional Groups See Appendix B (2 tables) and Table 2
Some characteristic infrared absorption frequencies BONDCOMPOUND TYPEFREQUENCY RANGE, cm-1 C-H alkanes 2850-2960 and 1350-1470 alkenes 3020-3080 (m) and RCH=CH2 910-920 and 990-1000 R2C=CH2 880-900 cis-RCH=CHR 675-730 (v) trans-RCH=CHR 965-975 aromatic rings 3000-3100 (m) and monosubst. 690-710 and 730-770 ortho-disubst. 735-770 meta-disubst. 690-710 and 750-810 (m) para-disubst. 810-840 (m) alkynes 3300 O-H alcohols or phenols 3200-3640 (b) C=C alkenes 1640-1680 (v) aromatic rings 1500 and 1600 (v) C≡C alkynes 2100-2260 (v) C-O primary alcohols 1050 (b) secondary alcohols 1100 (b) tertiary alcohols 1150 (b) phenols 1230 (b) alkyl ethers 1060-1150 aryl ethers 1200-1275(b) and 1020-1075 (m) all abs. strong unless marked: m, moderate; v, variable; b, broad
1 C5H10O 3400-3200 cm-1: no OH or NH present 3100 cm-1: no peak to suggest unsaturated CH 2900 cm-1: strong peak indicating saturated CH 2200 cm-1: no unsymmetrical triple bonds 1710 cm-1: strong carbonyl absorbance 1610 cm-1: no absorbance to suggest carbon-carbon double bonds Structure: IUPAC Name: 3-pentanone
2 C8H8O 3400-3200 cm-1: no OH or NH present 3100 cm-1: moderate peak suggesting unsaturated CH 2900 cm-1: weak peak indicating possible saturated CH 2200 cm-1: no unsymmetrical triple bonds 1690 cm-1: strong carbonyl absorbance 1610 cm-1: weak absorbance bands consistent with carbon-carbon double bonds Structure: IUPAC Name: acetophenone
3 C7H8O 3400-3200 cm-1: strong peak indicating OH is present 3100 cm-1: weak peak suggesting possible unsaturated CH 2900 cm-1: weak peak indicating possible saturated CH 2200 cm-1: no unsymmetrical triple bonds 1720 cm-1: no carbonyl absorbance 1450-1500 cm-1: moderate absorbance bands consistent with aromatic carbon-carbon double bonds Structure: IUPAC Name: benzyl alcohol
Raman Spectroscopy • When radiation passes through a transparent medium, the species present scatter a fraction of the beam in all directions. • In 1928, the Indian physicist C. V. Raman discovered that the visible wavelength of a small fraction of the radiation scattered by certain molecules differs from that of the incident beam and furthermore that the shifts in wavelength depend upon the chemical structure of the molecules responsible for the scattering.
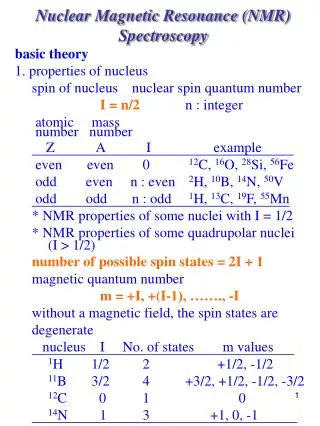
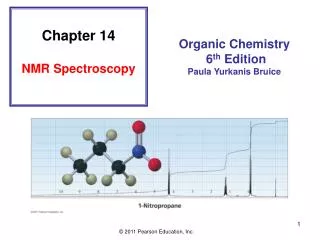
Definition of NMR Spectroscopy Nuclear magnetic resonance spectroscopy: commonly referred to as NMR,is a technique which exploits the magnetic properties of certain nuclei to study physical, chemical, and biological properties of matter Compared to mass spectrometry, larger amounts of sample are needed, but non-destructive
Energy Differentiation In the presence of an external magnetic field (B0), two spin states exist, +1/2 and -1/2 (For I=1/2).The magnetic moment of the lower energy +1/2 state is aligned with the external field, and that of the higher energy -1/2 spin state is opposed to the external field. Aligned against the applied field Aligned with the applied field
Fourier transformation and the NMR spectrum Fourier transform RF Pulse The Fourier transform (FT) is a computational method for analyzing the frequencies present in an oscillating signal The NMR spectrum
1H NMR and 13C NMR Spectrum 1H NMR spectra d ppm High field Down field 13C NMR spectra d ppm
Chemical Shift-d When an atom is placed in a magnetic field, its electrons circulate about the direction of the applied magnetic field. This circulation causes a small magnetic field at the nucleus which opposes the externally applied field The magnetic field at the nucleus (the effective field) is therefore generally less than the applied field by a fraction : B = B0 (1-s), So u = g B0 (1-s) / 2p
Standard for Chemical Shift In NMR spectroscopy, the standard is often tetramethylsilane, Si(CH3)4, abbreviated TMS. Tetramethyl silane (TMS) is used as reference because it is soluble in most organic solvents, is inert, volatile, and has 12 equivalent 1H and 4 equivalent 13C. TMS signal is set to 0