Download
1 / 44
490 likes | 789 Views
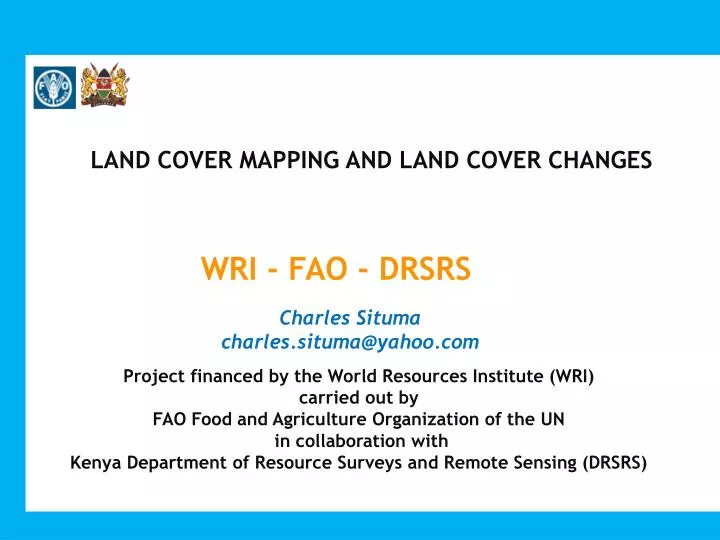
LAND COVER MAPPING AND LAND COVER CHANGES. WRI - FAO - DRSRS. Charles Situma charles.situma@yahoo.com. Project financed by the World Resources Institute (WRI) carried out by FAO Food and Agriculture Organization of the UN in collaboration with

E N D
LAND COVER MAPPING AND LAND COVER CHANGES WRI - FAO - DRSRS Charles Situma charles.situma@yahoo.com Project financed by the World Resources Institute (WRI) carried out by FAO Food and Agriculture Organization of the UN in collaboration with Kenya Department of Resource Surveys and Remote Sensing (DRSRS)
DEPARTMENT OF RESOURCE SURVEYS AND REMOTE SENSING (DRSRS) MANDATE • Collection, storage, analysis, updating and dissemination of geo-spatial information on natural resources and environment to facilitate informed decision-making for sustainable development • The data collected by the department forms the basis for formulation of sound development plans, policies and strategies various government ministries and agencies. • DRSRS strives to meet objectives and aspirations of the Ministry and GoK as outlined in Vision 2030
Project purposes: • Update of Kenya land cover map (FAO Africover database) 2000 - 2010 • Land Cover Changes Analysis
DELIVERABLES • National harmonized land cover legend based on FAO/UNEP Land Cover Classification System (LCCS) • National Land Cover Database • National Land Cover Changes database (shapefile and mdb) • PRODUCT DISSEMINATION • The data is hosted by DRSRS • - Results could be downloaded through FAO’s geospatial data portal GeoNetwork
Satellite imageinterpretationforland cover mapping Land Cover update - Workflow • Satellite - Imagesacquisition • Objectbasedsegmentation – DefiniensEcognition Software • Legend - based on FAO Land Cover Classification System / Africover • Prelabelingofimagesbased on former FAO Africover Data • Interpretationdetailenhancementnewtoolsforclassification and labeling - FAO Madcat Software • FieldworkActivities • Topologycheck • Interpretationreviewbased on field work results • Reviewofhomogenity and consistencyofinterpretationbetweenphotointerpreters • Reviewof Database fields and codes • GIS review – finaltopologycheck • Final database output – Data overviewthrough FAO ADG Software
1) Satellite images Aster Landsat (2000) Landsat (2005) Google Earth Landsat Aster Google Earth
A fieldwork campaign was carried out in March 2011. Areas to be surveyed were defined following a regular grid of 0.5 degrees 10*10 Km (ECONET) According with the accessibility of the areas (security issues, road network, time schedule) were defined 1 to 4 land cover classes to survey for each area. If the plot could not be reached, the points were selected out of the box in nearby areas.
The map shows the points for each one of the 3 fieldwork teams with additional points within the 10 km plots. (Source: DRSRS Final Report on Fieldwork Activities)
A sample field data record sheet filled in the field during survey –MDB format The total points visited by the 3 groups are as follows, Group1 : 60 points Group2: 84 points Group3: 50 points.
Sampling area Sample point • Sample point selection • The FAO Afrocover methodology for land cover field survey was illustrated in the last 2 days of the workshop held in DRSRS in January 2011. • Due to the fact that the preliminary interpretation was not yet completed was defined to use a regular grid as source to define the field points, as mentioned in the previous slide. • Within this areas, according with the accessibility and land cover type available in the area, were defined specific locations to survey (1-4 points for each block). • Each sample plot measured 10 Km x10 Km Figure 3.2). At least three sample points were surveyed in each plot The full procedure was run from the accessibility assessment, to the definition of field work results output. 10 Km 10 Km
Field Survey KE_167 Picture direction S Field Survey KE_167 Picture direction W For Each poin were recorded information about the land cover and 4 pictures in the cardinal directions N E S W The survey number and picture direction are visible in the blackboard in the picture After the field work, the data was downloaded and loaded in ArcGIS with all the details of each plot no and corresponding photos of each plot. An hyperlink was created in order to view the pictures linked to each point clicking on the point symbol
Legend 70 classes
Land Cover Interpretation Kenya Land Cover Map Preliminary Results Overview
Kenya LC database before field survey activity
Results Overview Land Cover Data – National Level • Total Areas: 1970’s, 1980’s, 2000, 2010 • 2 Changes: area values - percentages
Results Overview Forest, Agriculture, Urban areas Area Km2 Land cover type
Results – Woody Coverage Overview: Spatial Distribution Kenya 2000 Tree closed, Tree open and Woody closed areas
Results Closed forest coverage – Kenya Provinces
Results Urban areas – Kenya Provinces
Results Forest Plantations – Kenya Provinces
Results – Agriculture a Agricultural Area Changes – Areal Distribution Of Changes a1) 1970’s - 2000 a2) 1970’s - 1980’s a3) 1980’s - 2000 b Agricultural Field Density b1) 1970’s b2) 1980’s b3) 2000
Results – Agriculture Agricultural areas – Kenya Provinces Agricultural Areas Km2
Results – Agriculture Agricultural field density 1970’s • Kenya Land Cover Change analysis • Agricultural areas • The map shows the field density within the polygon area. • According with LCCS in the agricultural fields classification there are 3 levels of spatial distribution: • Continuous fields • Scattered clustered • Scattered isolated • Continuous fields cover > 80% of the polygon area when in single class codes and 50-80% when in mixed units • Scattered clustered between 20 and 50% of the polygon area • Scattered isolated between10 and 20% of the polygon area
Results – Agriculture Agricultural field density 1980’s • Kenya Land Cover Change analysis • Agricultural areas • The map shows the field density within the polygon area. • According with LCCS in the agricultural fields classification there are 3 levels of spatial distribution: • Continuous fields • Scattered clustered • Scattered isolated • Continuous fields cover > 80% of the polygon area when in single class codes and 50-80% when in mixed units • Scattered clustered between 20 and 50% of the polygon area • Scattered isolated between10 and 20% of the polygon area
Results – Agriculture Agricultural field density 2000 • Kenya Land Cover Change analysis • Agricultural areas • The map shows the field density within the polygon area. • According with LCCS in the agricultural fields classification there are 3 levels of spatial distribution: • Continuous fields • Scattered clustered • Scattered isolated • Continuous fields cover > 80% of the polygon area when in single class codes and 50-80% when in mixed units • Scattered clustered between 20 and 50% of the polygon area • Scattered isolated between10 and 20% of the polygon area
Results Overview Forest, Agriculture, Urban land cover area Area Km2 Land cover type
Land Cover Changes 2000 - 2010 – Partial results N.B. Total areas calculated considering the main class in mixed classes
Dataset Applications Main fields of application: • Planning (Land Use and Planning, Development Activities Planning) • Education • Research (Activities within Research Institutions and Universities) • Water (Water Conservation, Use and Control) • Agriculture (Soil and Land Conservation, Pest Control, Crop Monitoring) • Environment (Forestry, Biodiversity, Wildlife, Sensitive Areas, etc.) • Monitoring (Food Security, Early Warning) • Health (Disease control, health infrastructure, vaccination campaigns, etc.) • Other Application
Total number of request for Kenya 2323 – pending 9 – rejected 219 Total number of delivered data for Kenya
Other Initiatives • DRSRS is involved in: • Clinton Climate Initiatives on land cover mapping of Kenya • KFS REDD Readness plan for MRV (Monitoring, Reporting and Verification on Forests) • FAO/DRSRS Dryland forest mapping for REDD PASCO/KFS/RCMRD/DRSRS