Download
1 / 62
620 likes | 820 Views
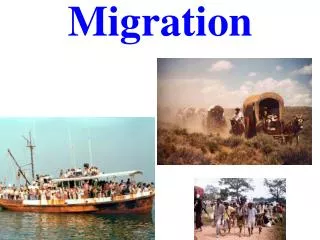
Migration Notes. Eight Great Modern Migrations. What is Modern? From 1450 on Generally the Renaissance. From Europe to North America. Religious freedom Puritan migration. From Iberia to South & Central America. Age of Exploration Treaty of Tordesillas Portugal got everything East of

E N D
Eight Great Modern Migrations • What is Modern? • From 1450 on • Generally the Renaissance
From Europe to North America • Religious freedom • Puritan migration
From Iberia to South & Central America • Age of Exploration • Treaty of Tordesillas • Portugal got everything East of line, Spain got everything West • Portugal occupied parts of Brazil (official language Portuguese) • Spain everywhere else • Economic migration
From British Isles to British Empire • To South Africa, Australia & New Zealand • Beginning of the British Empire • Economic migration • What about India? • Established trading posts in West Africa • From there moved to India • But not in huge numbers
From West Africa to Caribbean, S. America & American South • Caribbean • Jamaica (90% African descent) & Haiti (95%) • S. America • Coastal Brazil • American South • Smallest amount from West Africa came here
From India to British Empire • Slavery ends, British used Indians to harvest crops in British colonies • “Indian Diaspora” • Diaspora: From Greek for “to disperse” forced or voluntary dispersal of a people from their homeland to a new place • Kenya • S. Africa • SE Asia • Indonesia still has a small Hindu minority • Fiji • 2nd largest Ethnic group • Guyana • 28.4% Hindu • Suriname • Hindustani predominate ethnic group
From China to SE Asia & W. North America • “Chinese Diaspora” • SE Asia • Malaysia • Persecuted • Still 2nd highest ethnic group • Singapore • 76.8% of the population • “Bamboo Network” • A network of close-knit Chinese entrepreneurs with large corporate empires in southeast Asia • N. America • Seattle, San Francisco, & Vancouver
From E. North America to W. North America • Manifest Destiny • The 19th century belief that Americans would eventually expand west to the Pacific Ocean • What about Native Americans?
From W. Russia to E. Russia & Central Asia • Mirror image of N. America • Russians settled Siberia like we settled W. North America • What about native Siberians? • Handled like Native Americans • Poorer than other Russians • Set up on reservations • On the worst land
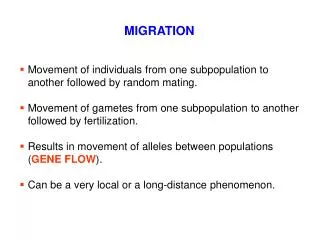
Movement • Mobility – All types of movement from one location to another. • Activity space – The space within which daily activity occurs; space allotted for a certain industry or activity. • Emigration – Migration from a location • Immigration – Migration to a new location • Net migration – The difference between the level of immigration and the level of emigration. • Emigration > Immigration = Net “out migration” • Immigration > Emigration = Net “in migration”
Types of Migration • Transnational • a.k.a. International Migration: Permanent movement from one country to another • Internal • Permanent movement within a particular country. • Chain • Migration of people to a specific location because relatives or members of the same nationality previously migrated there. • Step • Migration to a distant destination that occurs in stages, for example, from farm to nearby village and later to town and city. • e.g. Brazilian family moves from village to town and then finally Sao Paulo or Rio de Janeiro • Seasonal Agriculture • Transhumance : A seasonal periodic movement of pastoralists and their livestock between highland and lowland pastures. • Rural to Urban • Permanent move from an agrarian lifestyle to a city lifestyle
Types of Migration Voluntary Migration Forced Migration a.k.a. Involuntary migration Examples: Triangle Trade Atlantic Arm Native American relocation in Great Plains region of U.S. • Choose to migrate • Remember • Must be permanent • If they return (guest workers, time-contract workers) they are not included in these numbers
Internal Migrations • Two kinds • Intraregional • Interregional • Intraregional: people moving within one geographic region within a country • Urbanization: move from rural to urban • Suburbanization: move from urban to suburban • Counterurbanization: move from urban to rural • Interregional: people moving from one region to another within a country • Can be international if culture is maintained
Ravenstein’s “Laws” of Migration • British sociologist (1834 – 1913) • Laws of Migrations: • Most migrants go only a short distance (internal) • Distance Decay • If they do move a long distance, they are more likely to travel to a big city (Gravity Model) • Most migrations proceed step-by-step (Lee’s Model/Step Migration) • Most migration is from rural to urban • Every migration flow produces a counterflow • Rural migrants move to city; city dwellers move to suburbs • Families are less likely to make international moves than young adults • Most international migrants are young males • Changed with time; women comprise 40-60% of International migrants (55% of U.S. migrants)
Why? • Most people migrate for ECONOMICreasons • New jobs • Better wages • Escape poverty • Find higher standard of living • Push and Pull factors • Push: Factor that induces people to leave old residences. • Push us from one place • Pull: Factor that induces people to move to a new location. • Pull us to another
Migration Patterns • Intercontinental • From one continent to another • Interregional • From one region of a country to another • Intraregional • Within one region of a country • Rural to Urban
Migration Transition Model • Migration transition – Change in the migration pattern in a society that results from industrialization, population growth, and other social and economic changes that also produce the demographic transition. • Wilbur Zelinsky • Stage 1 • Migration for food, rather than permanent migration • Stage 2 • High population, technological improvements lead to out-migration • Stage 3 & 4 • Destination of international migrants from Stage 2 countries • Most internal migration is intraregional • Cities to suburbs
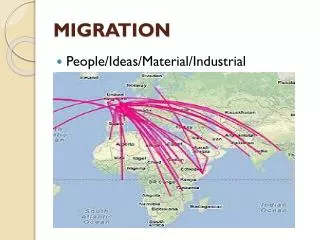
Global Migration Trends • 3 largest migration flows • Asia to Europe • Asia to North America • Latin America to North America • Net In Migration: Europe, North America & Oceania • Net Out Migration: Asia, Latin America & Africa
Case Study: Europe • 1800-1920 • CDR drops, population soars • Led to Europe being a source region for migrants • “Net Out Migration” • Other factors as well • Agriculture: Irish potato famine • Economic: Downturns in Europe; job opportunities in the U.S. • Cultural: Religious persecution; network connections/chain migration • Political: Instability, repression, lack of freedoms • 1960-2000 • CBR, CDR drops, increase in elderly population (graying of Europe) • Europe = destination for migrants, particularly from North Africa • “Net In Migration” • Results • Labor shortagesin Europe • Labor surplus in N. Africa • Overpopulated in N. Africa
U.S. Immigration Trends • 3 Phases • American colonies • European settlement, mainly British • African slaves • Nineteenth-Twentieth Century • 1840-1850: Western Europe • 1880s: Northern Europe • Beginning of Twentieth Century: Southern & Eastern Europe • 2nd Half of Twentieth Century • Latin America & Asia • Periods of Decline • U.S. Civil War, 1893 Depression, WWI, Great Depression, WWII
20th C. U.S. Immigration Early Late Source: Asia & Latin Am. Push: End of Cold War Poverty, lack of jobs Overpopulation (Stage 2) Religious/ethnic conflict Environmental problems Pull: U.S. shift to service-based industry Increased demand for low-wage jobs Expansion of ethnic economy Expansion of “agribusiness” High Tech Industry = need for software & hardware production • Source: E. & S. Europe • Push: • Political Instability (WWI, Russian Rev.) • Lack of jobs • Religious persecution • Overpopulation (Stage 2) • Pull: • U.S. Industrialization • Increased demand for labor • Specific industries: construction, transportation, city expansion
U.S. Internal Migration In Migration Out Migration Regions: Great Plains, Midwest, Rust Belt, Deep South, Corn Belt States: Alabama, Illinois, Kansas, Louisiana, Massachusetts, Montana, New York, North Dakota, South Dakota, Utah • Regions: • Pacific Northwest, Southwest, Northeast • States: • Arizona, California, Delaware, Florida, Maine, Maryland, New Hampshire, Tennessee, Vermont, Virginia
Why? • Economic Structure • Deindustrialization • Shift to service/technology industries away from agriculture • Suburbanization • Friction of Distance • Gravity Model (FoD tied to migration decisions) • Telecommuting (FoD not as important as it used to be) • Improved transportation/communication (FoD not as important) • Age Structure • Retirees moving to Sun Belt states, Florida • Young professionals move to areas for job opportunities • Young couples move to suburbs to provide lots of amenities
Refugees, Asylum Seekers, IDPs • Refugees • UN Definition: A person who has well-founded fear of being persecuted for reasons of race, religion, nationality, membership of a particular social group, or political group • Asylum Seekers • Someone who has applied for asylum and is waiting for a decision as to whether or not they are a refugee • U.S. 2012: 83,400 Asylum claims (10% from 2011) • Largest recipient of claims in the world • 7th year in a row • Internally Displaced Persons (IDPs) • Forcibly uprooted people displaced within their own country
Refugees • UN reports 45.2 million refugees worldwide • Numbers vary a lot • Two types • International refugees • Crossed one or more international borders and are in a country other than their own • Intranational • Abandoned their homes but not their homeland • IDPs
IDPs 2010 • Sudan • 4.9 million • Colombia • 3.3 million • Iraq • 2.7 million
How do you identify a refugee? • UN Definition • 3 General Characteristics • Move with only what they can carry • Begin journey by foot, bicycle, wagon or boat • Lack official documents usually needed for international migration
U.S. Refugee Numbers • Refugee Arrivals by Country of Nationality: Fiscal Years 2009 to 2011 201120102009 • Country of nationalityNumberPercentNumberPercentNumberPercent • Total ................ 56,384 100.0 73,293 100.0 74,602 100.0 • Burma ................ 16,972 30.1 16,693 22.8 18,202 24.4 • Bhutan ............... 14,999 26.6 12,363 16.9 13,452 18.0 • Iraq .................. 9,388 16.7 18,016 24.6 18,838 25.3 • Somalia ............... 3,161 5.6 4,884 6.7 4,189 5.6 • Cuba ................. 2,920 5.2 4,818 6.6 4,800 6.4 • Eritrea ................ 2,032 3.6 2,570 3.5 1,571 2.1 • Iran .................. 2,032 3.6 3,543 4.8 5,381 7.2 • DR Congo............. 977 1.7 3,174 4.3 1,135 1.5 • Ethiopia ............... 560 1.0 668 0.9 321 0.4 • Afghanistan ............ 428 0.8 515 0.7 349 0.5 • All other countries, • including unknown ............. 2,915 5.2 6,049 8.3 6,364 8.5
Examples • Syrian Refugees • Civil Wars in Liberia, Sierra Leone, Angola, & Sudan • Ethnic war between Hutu & Tutsi tribesin Rwanda • Has spilled over into DRC & Burundi • Displacement due to ongoing dispute between Israelis & Palestinians • Afghanistan • Due to Taliban rule • Soviet Invasion in 1970-80s • U.S. involvement during 2000s • “Boat People” who fled Communist rule in Vietnam
Yugoslavia • After the collapse of the former Yugoslavia, over 1 million were displaced • Formed 5 independent countries • Bosnia & Herzegovina • Croatia • Macedonia • Serbia & Montenegro (which later split) • Slovenia