Download
1 / 28
290 likes | 941 Views
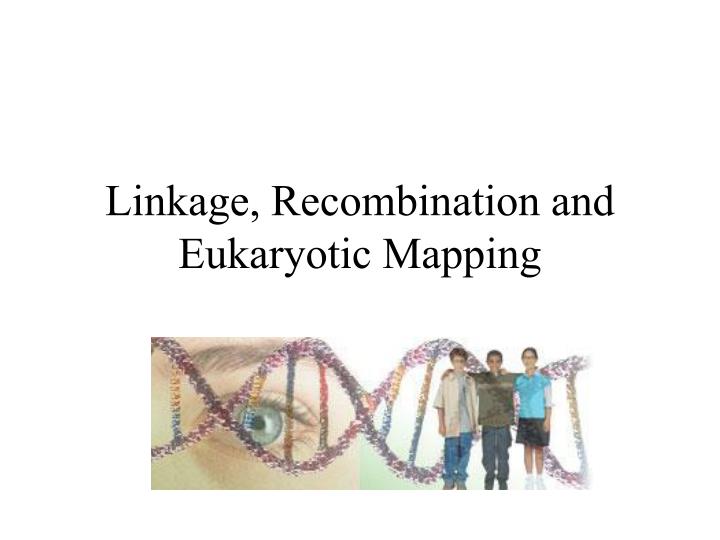
Linkage, Recombination and Eukaryotic Mapping. Outline. Introduction Complete Linkage compared to independent assortment Crossing over with linked genes “coupling and repulsion” gene arrangements Predicting outcomes with linked genes Gene mapping with recombination frequencies

E N D
Outline • Introduction • Complete Linkage compared to independent assortment • Crossing over with linked genes • “coupling and repulsion” gene arrangements • Predicting outcomes with linked genes • Gene mapping with recombination frequencies • 2-point test cross
Observed: certain traits in Drosophila tended to inherited together. Thomas Hunt Morgan 1866-1945 Suggested: these genes were on the same chromosome. Also suggested: gene close together rarely shuffled Alfred Sturtevant 1891-1970
Let’s compare inheritance of 2 linked genes with the inheritance of 2 genes that assort independently (like what we have already studied according to Mendel’s principles.)
According to Mendel(non-linked genes—this is review, ch. 3) • AaBb x AaBb • AaBb • aAbB • AABB • aabb Independent Assortment 3:1 Non-recombinants Recombinants
Linked genes • Genes located close together on the same chromosome
Linked Genes On the same chromosome genes “travel” together and arrive a the same destination. But how can you tell when a gene is linked or if it is independent?
Use the Test Cross Method If Independent If Completely Linked: MmDd x mmdd m d M D x m d m d m d m d M D m d MmDd or mmdd Mmdd or mmDd or 50% non-recombinants 50% -recombinants 50% 50% 1:1:1:1 ALL NON-RECOMBINANTS
Sometimes however the linkage is “broken” by a process called CROSSING OVER”. “Incomplete Linkage” It is another way to recombination
Crossing Over (meiosis—prophase 1) Physical exchange of DNA Intrachromosomal Recombinantion
How do we know if crossing over occurs between linked genes? • Again use a test cross and look the offspring distribution. • Let’s continue to use the same test cross: m d M D x m d m d
Calculation of Recombination Frequency 8 +7 55+53+8+7 X 100 = 12%
RF allows you to prediction proportion of expected offspring with linked genes If you know that RF = 16% T= warty d= dull color
Recombination Frequencies (RF) • Can be used to determine the order of genes on a chromosome. • Chromosome maps determined from RF are called“Genetic Maps”. • Distances are given in map units (m.u.) or centimorgans (cM) • 1 m.u.= 1% recombination • 50% RF is expected with independent assortment (or distant genes)
First a few simple examples of displaying a “genetic map” • 2 point test crosses were done and the results follow
1. Genetic Map using RF • A to B = 5 m.u. • B to C= 10 m.u. • A to C = 15 m.u. • Then a simple genetic map using RF is A 5 m.u. B 10 m.u. C
2. Genetic Map using RF • A to D = 8 m.u. • B to D= 13 m.u. • C to D = 23 m.u. Another set of 2 pt test cross Now include “D” to the previous map, what would the map look like now? A 5 m.u. B 10 m.u. C
2 point test cross map:data given from a series of test crosses • RF • a and b 50% • a and c 50% • b and c 20 • b and d 10 • c and d 28
Genetic MapRF values from 2 point test cross b c . 20 m.u.
Genetic MapRF values from 2 point test cross d b c 10 m.u. 20 m.u. 30 m.u.
3 point test cross (to be applied to your problem)
Interference and Co-efficient of coincidence (CC) • CC= # of observed double crossovers/# of expected double crossovers