Download
1 / 16
160 likes | 446 Views
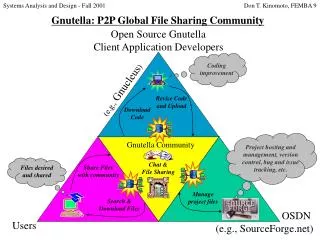
Patterns around Gnutella Network Nodes. Sui-Yu Wang. Introduction.

E N D
Patterns around Gnutella Network Nodes Sui-Yu Wang
Introduction • Recent study shows that the distribution of topology in Gnutella network is not purely random. This might imply the possibility of the existence of frequent patterns around nodes in the network. The construction of this model not only help further understanding of this network but also possible improvement of routing algorithm.
Goal • Find out the existence of frequent patterns • Verify the validity of the model • Use this model to predict patterns around nodes that is not in the training data
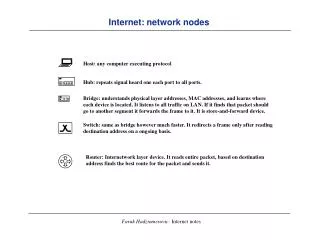
Representation of the Network (1) • Undirected Graph G = { N, E} • N { center, depth_1,…, depth_n } • E { 1, 2,…, TTL } • The depth of nodes other than the center node is defined as the shortest path from that node to the center
Representation of the Network (2) AA 2 2 2 2 BCB C 1 1 1 1 D E D E G = { N(A) = (depth 2), N(B) = (center), N(c) = (depth 2), N(D) = (depth 1), N(E) = (depth 3), E(A,B) = 2, E(B,D) = 1, E(B,C) = 2, E(C,E) = 1 Each G is called one transaction
Frequent Subgraph Discovery • Developed by Michihiro Kuramochi, George Karypis • Able to mine patterns in a set of transaction give minimum frequency the patterns appear in the set • Gives parent-child relation between subgraphs
Power Law • The frequency, , of an out degree, d, is proportional to the out degree to the power of the constant, O
Stratified Sampling • Principle of Stratification : partitions are best performed by partitioning data so that samples in each strata are most similar to each other • Population of nodes are partitioned into strata • Partition by size of transaction • Partition by the power law
Experiment (1) • Find out the frequent patterns in two set of data collected at the same time but belong to different connected component • The comparison between two distributions is performed by comparing the relation of frequent subgraphs in each strata • The maximum depth in each graph is set to be 3 • The TTL is 1 • Data is partitioned by the size of transaction
Relative Frequency Set 1 Set 2 Graph 1 75.4 74.2 Graph 2 100 100 Graph 3 74.5 73.2 Graph 4 79.5 71.5 Graph 5 79.5 71.5 Graph 6 74.5 73.2
Experiment (1) • There are one pattern of size 3, 2 patterns of size 4, and 2 patterns of size 5 missing in data set 2 • Missing parent will cause missing child • Grouping based on power law shows similar result • Possible reason for difference • Size of data • Classification error • Incomplete observation of the true distribution
Experiment (2) • Two connected component of size 591 and 524 taken from different time • Data from transaction of size less than 15 • All subgraphs matches
Experiment (3) • Grouping by size of transaction • TTL = 3 • Depth = 3 • Result shown are patterns with size 6 of transactions of size 20 to 50 • Set 1 size 269 and set 2 size 491 • Five patterns are missing from set 1 • One patterns are missing from set 2
Prediction Model • Suppose the model has a graph G with two children and • The frequency of them are , and • If a node finds a has a subgraph isomorphism with G, the chances of finding and in are / and / respectively