Download
1 / 15
150 likes | 164 Views
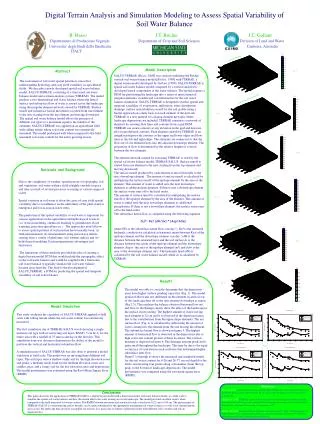
Simulation and Forecast of Subseasonal Variability of Hurricane Activity. Kathy Pegion Center for Ocean-Land-Atmosphere Studies Philip Pegion NOAA/NCEP/CPC Mihai Sirbu Center for Ocean-Land-Atmosphere Studies. Counts of Atlantic TS and Hurricanes every 6 hrs.

E N D
Simulation and Forecast of Subseasonal Variability of Hurricane Activity Kathy Pegion Center for Ocean-Land-Atmosphere Studies Philip Pegion NOAA/NCEP/CPC Mihai Sirbu Center for Ocean-Land-Atmosphere Studies
Counts of Atlantic TS and Hurricanes every 6 hrs Tropical cyclones tend to cluster in time and space on subseasonal timescales. Is this predictable? Can it be forecasted with a dynamical model?
Questions Can the relationship between MJO and tropical cyclone activity be captured using common hurricane indices (eg. SGP and GPI)? How well does the CFS simulate the relationship? Can forecasts of these indices by the CFS be used to predict where tropical cyclone formation is more/less likely on 1-4 week timescales?
Hurricane Indices Seasonal Genesis Parameter (Gray 1979) SGP=vorticity*coriolis*shear*thermal energy*moist stability *RH Genesis Potential Index (Emanuel and Nolan 2004) GPI=absolute vorticity*RH * Potential Intensity * shear
Climatology and Standard Deviation of SGP & GPI NCEP Reanalysis-2 All tropical storm formations from the Hurricane Best Track Database 1979-2007
Western Pacific Phase 7 Phase 6 Phase 5 Phase 8 RMM2 W. Hemisphere & Africa Maritime Continent Phase 1 Phase 4 Phase 2 Phase 3 RMM1 Indian Ocean MJO Index Real-time Multivariate MJO Index (Wheeler and Hendon 2004) (obtained from Matt Wheeler, BMRC; 1975-2000) Based on combined EOFs of U200, U850, and OLR First two PC timeseries (RMM1 & RMM2) represent the MJO amplitude and phase SQRT(RMM12+RMM22) > 1
Composite OLR (W/m2) anomalies (Jun-Nov) Observed CFS03 • Large-scale region of enhanced/suppressed convection • Eastward propagation • Note enhanced/supressed convection in Central America
Composite anomalies (Jun-Nov) Based on observed RMM Obs OLR R2 SGP R2 GPI • SGP & GPI vary with phase of MJO • SGP & GPI are very similar
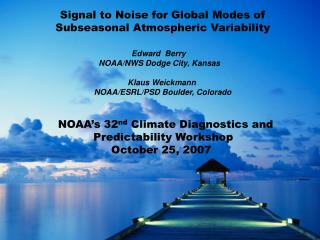
Composite SGP & GPI anomalies (Jun-Nov) Reanalysis-2 (1979-2007) SGP GPI Location of tropical storm formations from Hurricane Best Track Database 1979-2007 obtained from Unisys • Actual formations are generally consistent with regions of +/- SGP/GPI anomalies
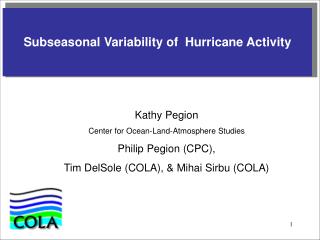
CFS NCEP/R2 SGP Climatology (Jun-Nov) SGP Standard Deviation
NCEP/R2 CFS03/T62 Composite SGP (Jun-Nov) CFS is generally able to capture the overall behavior of the relationship between the MJO and SGP
NCEP/R2 CFS03/T62 ERA40
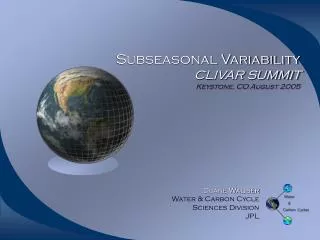
Correlations between CFS forecasts and NCEP/R2 (Aug-Oct 2005-2007) Full Fields of SGP, not anomalies, no MJO filter Week-2 Week-1 Week-3 Week-4
Conclusions SGP & GPI indices capture the relationship between MJO and tropical cyclone development. The CFS is generally able to capture the relationship There are promising prospects for using SGP forecasts as guidance for forecasts for weeks 1-4 in some regions.