Download
1 / 16
160 likes | 172 Views
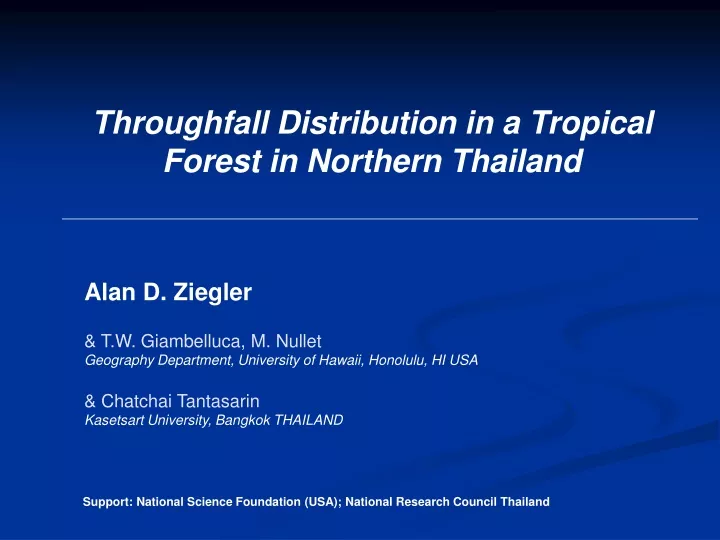
Throughfall Distribution in a Tropical Forest in Northern Thailand. Alan D. Ziegler & T.W. Giambelluca, M. Nullet Geography Department, University of Hawaii, Honolulu, HI USA & Chatchai Tantasarin Kasetsart University, Bangkok THAILAND.

E N D
Throughfall Distribution in a Tropical Forest in Northern Thailand Alan D. Ziegler & T.W. Giambelluca, M. Nullet Geography Department, University of Hawaii, Honolulu, HI USA & Chatchai Tantasarin Kasetsart University, Bangkok THAILAND Support: National Science Foundation (USA); National Research Council Thailand
THROUGHFALL: fraction of gross rainfall dripping through the canopy Gross Rainfall QUESTION 1 wet-canopy evaporation? Alan D. Ziegler & T.W. Giambelluca, M. Nullet Geography Department, University of Hawaii, Honolulu, HI USA & Chatchai Tantasarin Kasetsart University, Bangkok THAILAND Throughfall Stemflow (small: < 3-5%) Chappell et al.,2001 Important for water balance estimation
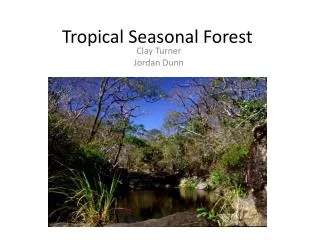
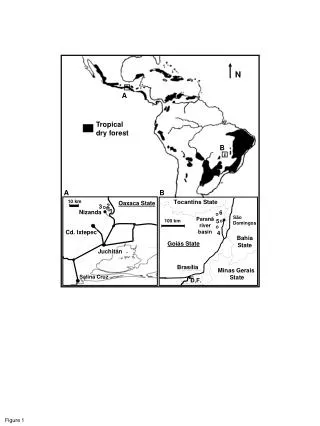
STUDY SITE PANG KHUM EXPERIMENTAL WATERSHED mixed-use | swidden agriculture Forest (25%) NRCT-SPONSORED THAILAND ROADS PROJECT SITE (1995 – 2005)
FOREST PLOT Hill Evergreen Forest: Wendlandia tinctoria, Stryax benzoides, Castanopsis tribuloides 30m 94-ha 1100 – 1800 m RF Annual rainfall = 1200-2000 mm
DESIGN:TWO Measurement Methods 4 Spiders (stationary, 5-cm x 4-m rails, tipping bucket gauges) QUESTION 2 stationarymobile 20 Rovers (mobile, 26-cm standard-type gauges)
DESIGN:MEASUREMENT LOCATIONS 0 5 10 15 20 25 30 35 0 5 10 15 20 25 30 35 Grid cell (m) Year 2001 108 days | 49 events | 11 Periods 4 spider locations Grid cell (m) 179 rover locations 500 m2 102 Trees 20 Evergreen 6 Deciduous 5 trees / grid
2 CORRECTIONS DEVICE CALIBRATION (vs. RAIN GAUGE) DYNAMIC CALIBRATION (spiders & rain gauge) Intensity-related errors Splash errors related to design RF
THROUGHFALL ESTIMATES 81% 79% Fraction of total RF 49 event medians RAINFALL: 49 events | 1130 mm ROVERS SPIDERS BASIS 76% 72% Median of 49 events Rover-derived TF mobile stationary ROVERS>SPIDERS But… NOT SIGNIFICANT Spider-derived TF
QUESTION 3: COMPARABLE Prior Hill and Dry Evergreen Forest Studies in Thailand 9 90 1 9 89 2 Tanaka (2003) 4 95 1 30 69 <1 Range: 70-95% PKEW DISTURBED FOREST in the middle FEW LARGE TREES NON-COMPLEX CANOPY PKEW: ~80% QUESTION: Real differences or Differences in techniques?
Probability Distribution Slightly skewed Range (20-190%) Values > 100% are real (“pour” points) ROVERS 0 100 200 300 400 Percent of rainfall (%) Median = 68% Data of Dykes (1997), Hall and Roberts (1990), Lloyd and Marques (1988)
Stabilization of TF Estimate events area small large few many all rover data Throughfall Throughfall Area (m2) 0 45 90 135 180 June July Aug Sept Oct Number of rovers probably SUFFICIENT DATA SUFFICIENT DATA
Canopy Cover verses Throughfall No relationship Although TF distribution is affected by the 3-4 largest trees via pour points and shadows Somewhat homogeneous Non-homogeneous Range =0–4 Range =20 - 190% [Interpolation via simple kriging]
CONCLUSONS TF Sensitive to RF measurements e.g., 7% if different rainfall station used Dynamic Calibration is Crucial For high-intensity tropical rainfall Mobile = Stationary measurements If sufficient area and adequate range of events sampled Wet Canopy Evaporation on order of 15-20% Stemflow estimate in progress TF f (canopy cover) Others factors: wind-driven rainfall, topography, role of dominant trees TF correlation distance < 2 m (< ½ average crown diameter) … highlights difficulty in scaling up TF in the catchment
Thank You! Alan Ziegler adz@hawaii.edu
Influence of Event Size Big events have higher TF Throughfall (mm) < 60%