Download
1 / 16
160 likes | 320 Views
TC Projects. Joint Hurricane Testbed , Surface winds GOES-R, TC structure TC Size TPW & TC size (Jack Dostalek ) IR climatology RMW/wind profile Proving Ground RGB (MI + GEO) Hurricane Forecast Improvment Program (HFIP) NPP PSDI. Surface Wind Analysis.

E N D
TC Projects • Joint Hurricane Testbed, Surface winds • GOES-R, TC structure • TC Size • TPW & TC size (Jack Dostalek) • IR climatology • RMW/wind profile • Proving Ground • RGB (MI + GEO) • Hurricane Forecast Improvment Program (HFIP) • NPP • PSDI
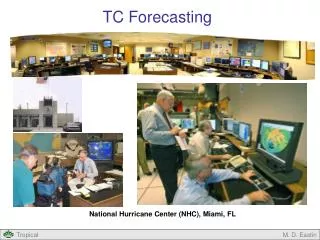
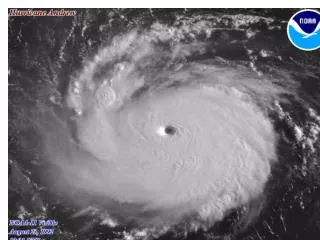
Surface Wind Analysis • This project seeks to create a real-time and fully automated surface wind analysis system at the National Hurricane Center (NHC) by combining the existing satellite-based six-hourly multi-platform tropical cyclone surface wind analysis (MTCSWA) and aircraft reconnaissance data. • Replicate the subjective procedures used in NHC operations 66th IHC, Charleston, SC
Inputs Satellite surface wind estimate aircraft
Sample Output Combined field wind estimate aircraft
Output Field (grads/N-Awips) Text Automated Tropical Cyclone Forecast system (ATCF) fixes N-Awips SFMR Flight-Level Analyses
Inputs Satellite surface wind estimate aircraft
Sample Output Combined field wind estimate aircraft
TC SIZE via IR images • Create a multiple linear regression that estimates TC circulation (V500, based on GFS) based on • IR principle components ( first 3) • Storm latitude • Estimates TC size by scaling TC circulation to a radius where the TCs influence vanishes at 850 hPa (R5) using a climatological vortex decay rate • The algorithm explains 29% of the V500 variance 20th AMS Conference on Applied Climatology
Major (>95kt) TC Examples: HAGUPIT (2008, 09/23 12:30) Rank 2/266 (0.8%)West Pacific Rank 2/738 (0.3%) Globally FELICIA (1997, 07/19 06:00) Rank 158/158 (100.0%)East Pacific Rank 737/738 ( 99.9%) Globally Vmax:115kt Lat: 15.60oN PC1: 0.17 PC2: -2.36 PC3: -0.87 Vmax:125kt Lat: 20.73oN PC1: -2.04 PC2: 2.65 PC3: 0.55 V500: 2.92 m/s R5 : 5.14oLat V500: 11.90 m/s R5 : 19.58oLat 20th AMS Conference on Applied Climatology
Basin Specific TC size Distributions North Atlantic Tropical Storms (34 kt ≤ Vmax ≤ 63 kt) Minor TCs/Hurricanes/Typhoons (64 kt ≤ Vmax ≤ 95 kt) Major TCs/Hurricanes/Typhoons (Vmax > 95 kt) Eastern North Pacific • Findings: • TCs become larger as they intensify • East Pacific has the smallest TCs • The West Pacific has the largest size distributions • Atlantic has the largest ranges of TC size Western North Pacific Frequency of Occurrence North Indian Ocean Southern Hemisphere TC Size (R5) 20th AMS Conference on Applied Climatology
Radius of Maximum Wind Developmental Data Ike 2008 • Create high resolution analyses from aircraft-based observations • Develop a climatology • Relate the resulting winds to features in the satellite data
RED(CIM-TCI) Enhanced IR Scaled/Grey Component
GREEN(CIM-TCI) Enhanced WV Scaled/Grey Component
BLUE(CIM-TCI) Enhanced 89GHz Scaled/Grey Component