Download
1 / 13
190 likes | 408 Views
HNC Business Management Thursday 29th March 2012. Review/recap on previous knowledge Standard Deviation Standard Deviation exercise Process Capability Process Capability exercise Set scene for next lesson. Process Capability. How Do We Analyse Statistical Data ?. Frequency.

E N D
HNC Business Management Thursday 29th March 2012 Review/recap on previous knowledge Standard Deviation Standard Deviation exercise Process Capability Process Capability exercise Set scene for next lesson Process Capability
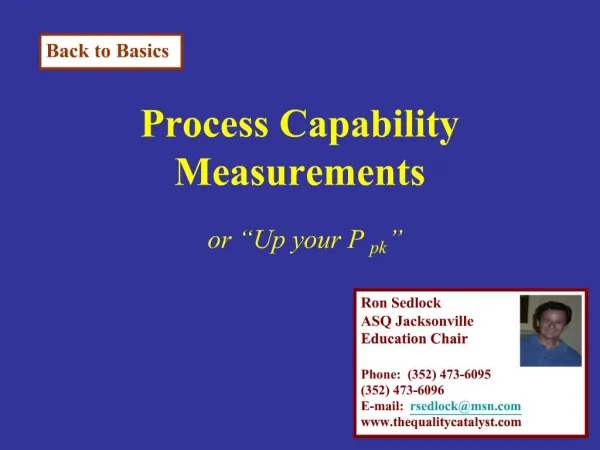
How Do We Analyse Statistical Data ? Frequency 13.0 14.0 10.0 10.0 15.0 13.0 13.0 15.0 14.011.0 16.0 9.0 15.0 12.0 10.0 12.0 13.011.0 14.0 17.0 16.0 14.0 11.0 12.0 13.0 13.013.0 14.0 13.0 12.0 13.0 14.0 15.0 13.0 16.012.0 12.0 13.0 13.0 12.0 15.0 11.0 12.0 12.0 9 10 11 12 13 14 15 16 17 TABLE BAR CHART
2 Standard Deviation, = (x - x) Standard Deviation s å (n-1) Indicates the degree of natural variation
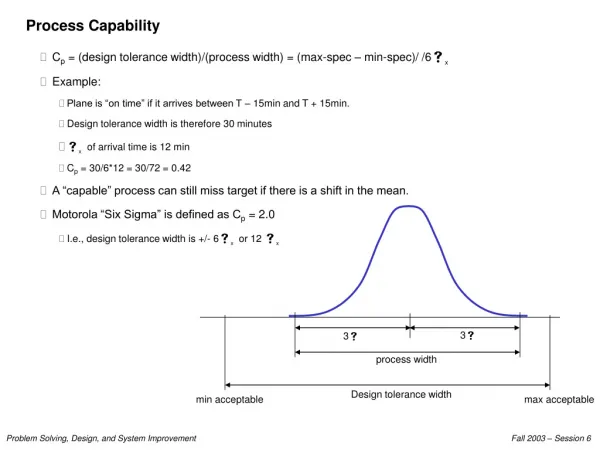
Standard Deviation +/- 1s +/- 2s +/- 3s x 68.3% 96% 99.7%
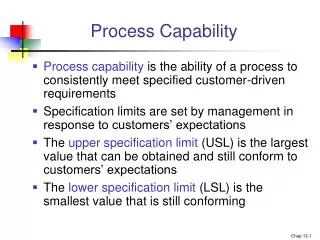
Process Capability • Statistical Control - output of all processes vary - natural variation is unavoidable • Process Capability - assesses acceptability of natural variation in relation to customer specifications
Define Process Capability Capable All product measurements fall within customer specification limits Incapable Some product measurements fall consistently outside customer specification limits Capability is quantified using Process Capability Indices
Accuracy And Precision x x x x x x x x x x x Precise but not accurate Accurate but not precise
Process Capability: The Concept • Machine capability versus Process Capability: • Machine Capability refers to the reproducibility under one set of process conditions ( e.g. one operator, homogeneous raw material, uniform manufacturing practise). • Process Capability refers to the reproducibility over a long period of time with normal changes in workers, material, and other process conditions. Process Capability = Machine Capability + Process Control
Capability Indices Capability = What customer wants What we can achieve Cm or Cp = USL - LSL 6 Cmk or Cpk = X - LSL or USL - X 3 3 s lowest value represents biggest risk s s
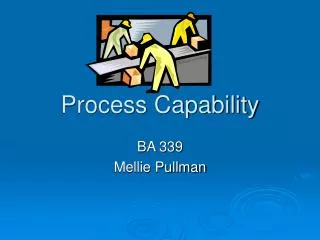
Capability Indices Cp < 1 Cp > 1 Cp > 1 Cp = 1 Cp > 1 LSL USL LSL USL LSL USL LSL USL LSL USL 6s 6s 6s 6s 6s Cpk < 1 Cpk < 0 Cpk =0 Cpk = 1 Cpk > 1 Precision = Bad Accuracy = Good Precision = Good Accuracy = Bad Precision = Good Accuracy = Bad Precision = Medium Accuracy = Good Precision = Good Accuracy = Good
V V V Capability Expectations Telecommunications Cpk 2.00 (6s / 3s) Automotive Cpk 1.67 (5s / 3s) Food Cpk 1.33 (4s / 3s)
Capability Expectations x USL LSL 6s 6s 6s