Download
1 / 50
500 likes | 680 Views
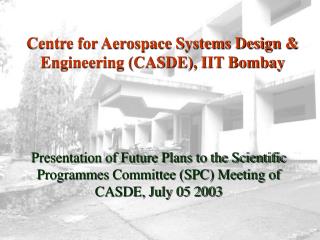
Aerodynamic Design Optimization Studies at CASDE. Amitay Isaacs, D Ghate, A G Marathe, Nikhil Nigam, Vijay Mali, K Sudhakar, P M Mujumdar. Centre for Aerospace Systems Design and Engineering Department of Aerospace Engineering, IIT Bombay http://www.casde.iitb.ac.in. About CASDE.

E N D
Aerodynamic Design Optimization Studies at CASDE Amitay Isaacs, D Ghate, A G Marathe, Nikhil Nigam, Vijay Mali, K Sudhakar, P M Mujumdar Centre for Aerospace Systems Design and Engineering Department of Aerospace Engineering, IIT Bombay http://www.casde.iitb.ac.in SAROD 2003
About CASDE • 5 years old • Master’s program in Systems Design & Engineering • MDO • MAV • Modeling & Simulation • Workshops/CEPs/Conferences SAROD 2003
Optimization Studies –Overview • Concurrent aerodynamic shape & structural sizing of wing • FEM based aeroelastic design • MDO architectures • WingOpt software • Propulsion system • Engine sizing & cycle design • Intake duct design using CFD SAROD 2003
Intake Design - Background • Duct design practice of late 80s – based on empirical rules • Problem Revisited – using formal optimization and high fidelity analysis • Study evolved with active participation of ADA (Dr. T.G. Pai & R.K.Jolly) SAROD 2003
Problem Formulation Entry Exit Location and shape (Given) • Objective/Constraints • Pressure Recovery • Distortion • Swirl Optimum geometry of duct from Entry to Exit ? SAROD 2003
Design Using CFD - Issues • Simulation Time • CFD takes huge amounts of time for real life problems • Design requires repetitive runs of disciplinary analyses • Integration & Automation • Parametric geometry modeling • Grid generation • CFD solution • Objective/Constraint function evaluation • Optimization • Gradient Information • Finite difference – step size (??), (NDV + 1) analyses required • Exact formulations – Automatic differentiation (ADIFOR), Adjoint method, Complex step method – All require source code SAROD 2003
Flow Solver • Distortion & Swirl calculation requires NS solution • In-house NS Solver • Analytical gradients possible • Easy to integrate • Commercial Solvers (STAR-CD, FLUENT…) • Gradients using finite difference only • Difficult to integrate • FLUENT Inc. • S-shaped non-diffusing duct • Results validated with a NASA test case (Devaki Ravi Kumar & Sujata Bandyopadhyay) SAROD 2003
Strategies • Reducing Time • Parameterization • Variable fidelity to shrink the search space • Surrogate modeling • Meshing • Parallel computing • Continuation • Integration & Automation • Wrapping executables and user interfaces • Offline analysis (Surrogate models) – semi-automatic SAROD 2003
Our Strategy Variable fidelity Response Surface based design using FLUENT SAROD 2003
CFD analysis at DOE points RS for PR & DC60 DOE in reduced space Low fidelity Analysis Optimization Constraints Parametrization Our Methodology SAROD 2003
Y Z X X DuctCenterline • Control / DesignVariables • Ym, Zm • AL/3, A2L/3 A X Cross SectionalArea Parametrization SAROD 2003
Y Z X X Duct Centerline • Control / DesignVariables • Ym, Zm • AL/3, A2L/3 A X Cross Sectional Area Parametrization SAROD 2003
Typical 3D-Ducts SAROD 2003
Duct Design - Low Fidelity X2-MAX • Low Fidelity Design Rules (Constraints) • Wall angle < 6° • Diffusion angle < 3° • 6 * Equivalent Radius < ROC of Centerline • Objective function: pressure recovery • No low fidelity analysis for distortion or swirl X2-MIN X1-MAX X1-MIN SAROD 2003
Optimization Process – Low Fidelity SAROD 2003
Automation for CFD Duct Parameters (β1, β2, αy, αz) Clustering Parameters Generation of structured volume grid using parametrization Generation of entry and exit sections using GAMBIT Entry & Exit sections Mesh file Conversion of structured grid to unstructured format Conversion of file format to CGNS using FLUENT Unstructured CGNS file Continuation Solution CFD Solution using FLUENT End-to-end (Parameters to DC60) automated CFD Cycle. CFD Solution DC60 Objective/Constraints evaluation Using UDFs (FLUENT) SAROD 2003
Automation for Design Duct Parameters (β1, β2, αy, αz) Generation of structured volume grid using parametrization Entry & Exit sections Conversion of structured grid to unstructured format Optimization Unstructured CGNS file Continuation Solution CFD Solution using FLUENT CFD Solution DC60 Objective/Constraints evaluation Using UDFs (FLUENT) SAROD 2003
Results: Total Pressure Profile SAROD 2003
Optimized duct from low fidelity Infeasible duct Poor duct P (0.61, 0.31, 1.0, 1.0) (0.1, 0.31, 0.2, 0.6) (-0.4, 1.5, 0.3, 0.6) PLOSS 1.42 2.0 3.53 DC60 6.19 16.28 24.21 P – Parameters; PLOSS – Total Pressure Loss Design Space Reduction SAROD 2003
Optimization Post-processing • Distortion Analysis • DC60 = (PA0 – P60min) /q where, PA0 - average total pressure at the section, P60min - minimum total pressure in a 600 sector, q - dynamic pressure at the cross section. • User Defined Functions (UDF) and scheme files were used to generate this information from the FLUENT case and data file. • Iterations may be stopped when the distortion values stabilize at the exit section with reasonable convergence levels. SAROD 2003
Duct Parameters Journal file Generate new case file Old Data file FLUENT Solution Continuation Method • Methodology • Store the solution in case & data files • Open the new case (new grid) with the old data file • Setup the problem • Solution of (0.61 0.31 1 1) duct slapped on (0.1 0.31 0.1 0.1) Huge benefits as compared to the efforts involved!!! SAROD 2003
Simulation Time • Strategies • Continuation Method • Parallel execution of FLUENT on a 4-noded Linux cluster Time for simulation has been reduced to around 20%. SAROD 2003
Sequential (Multipoint) Response Surface Approximations SAROD 2003
Sequential (multipoint) Response Surface Methodology Response Surfaces generated in sub-domains around multiple points Surfaces used to march to optimum SAROD 2003
Wing aerodynamic design problem Planform fixed 2 spanwise stations 4 variables for camber 3 variables for geometric pre-twist Maximize cruise L/D Lift constraint SAROD 2003
Design Problem Statement Maximize L/D Sub. to CL = .312 -5r + m 5 -5r + m + t 5 with side constraints, .05 x1 .33; .001 h1 .1 .05 x2 .33; .001 h2 .1 -2r 5 -2m 5 -2t 5 SAROD 2003
Design Tools • Lift Calculation: CL from VLM • Drag Calculation: CD0 from a/c data CDi from VLM • DOE: Design Expert • D-optimality Criterion • Response Surfaces: Design Expert • quadratic/cubic • Optimizers : FFSQP SAROD 2003
Overall Design Procedure SAROD 2003
Results - Arbitrary Starting Point 1 SAROD 2003
Results - Arbitrary Starting Point 2 SAROD 2003
Observations Quadratic model found better than cubic model in subspaces. Global model inadequate. Cost of D-optimality significant SRSA seems to work well! SAROD 2003
GRADIENT INFORMATION BY AUTOMATIC DIFFERENTIATION OF CFD CODES SAROD 2003
Analysis Code in Fortran Manually extract sequence of mathematical operations Manually differentiate mathematical functions - chain rule FORTRAN source code that can evaluate gradients Code the complex derivative evaluator in Fortran User Supplied Analytical Gradients SAROD 2003
Automatic Differentiation for Analytical Gradients Automatically parse and extract the sequence of mathematical operations Analysis Code in FORTARN Use symbolic math packages to automate derivative evaluation FORTRAN source code that can evaluate gradients Automatically code the complex derivative evaluator in Fortran SAROD 2003
Complex Analysis Code in FORTARN Automated Differentiation Package eg. ADIFOR & ADIC FORTRAN source code that can evaluate gradients Automatic Differentiation for Analytical Gradients Euler SAROD 2003
1.12 3.06 4.11 d(L/D) / d using ADIFOR 5.48 -0.38 -1.20 d(L/D) / dusing Finite Difference =0.2 Value 5.09 -0.52 -1.23 % Error 7.17 38.10 2.46 =0.02 Value 5.44 -0.40 -1.18 % Error 0.70 4.44 1.73 =0.002 Value 5.45 -0.41 -1.18 % Error 0.61 7.08 1.56 =0.0002 Value 5.56 -0.67 -1.02 % Error 1.54 77.25 15.09 Comparison of Derivative Calculation Finite Difference vs ADIFOR SAROD 2003
Optimization - ADIFOR vs FD • Single design variable unconstrained optimization problem • Find for max. L/D for Onera M6 wing • Same starting point; FD step size 0.002 SAROD 2003
Thank You Please visit www.casde.iitb.ac.in for details and other information SAROD 2003
Thank You http://www.casde.iitb.ac.in/mdo/3d-duct/
Problem Statement • Ambient conditions: 11Km altitude • Inlet Boundary Conditions • Total Pressure: 34500 Pa • Total Temperature: 261.4o K • Hydraulic Diameter: 0.394m • Turbulence Intensity: 5% • Outlet Boundary Conditions • Static Pressure: 31051 Pa (Calculated for the desired mass flow rate) • Hydraulic Diameter: 0.4702m • Turbulence Intensity: 5% SAROD 2003
Duct Parameterization • Geometry of the duct is derived from the Mean Flow Line (MFL) • MFL is the line joining centroids of cross-sections along the duct • Any cross-section along length of the duct is normal to MFL • Cross-section area is varied parametrically • Cross-section shape in merging area is same as the exit section SAROD 2003
y(Lm/2), z(Lm/2) specified Cmerger y2, z2 y(x), z(x) y1, z1 Centry x 0 Lm/2 Lm MFL Design Variables - 1 • Mean flow line (MFL) is considered as a piecewise cubic curve along the length of the duct between the entry section and merging section Lm : x-distance between the entry and merger section y1, y2, z1, z2 : cubic polynomials for y(x) and z(x) SAROD 2003
MFL Design Variables - 2 • y1(x) = A0 + A1x + A2x2 + A3x3, y2(x) = B0 + B1x + B2x2 + B3x3 • z1(x) = C0 + C1x + C2x2 + C3x3, z2(x) = D0 + D1x + D2x2 + D3x3 • y1(Lm)= y2 (Lm), y1’(Lm)= y2’(Lm), y1”(Lm)= y2”(Lm) • z1(Lm)= z2 (Lm), z1’(Lm)= z2’(Lm), z1”(Lm)= z2”(Lm) • y1’(Centry) = y2’(Cmerger) = z1’ (Centry) = z2’(Cmerger) = 0 • The shape of the MFL is controlled by 2 parameters which control the y and z coordinate of centroid at Lm/2 • y(Lm/2) = y(0) + (y(L) – y(0)) αy 0 < αy < 1 • z(Lm/2) = z(0) + (z(L) – z(0)) αz 0 < αz < 1 SAROD 2003
Area Design Variables – 1 • Cross-section area at any station is interpolated from the entry and exit cross-sections • A(x) = A(0) + (A(Lm)–A(0)) * β(x) • corresponding points on entry and exit sections are linearly interpolated to obtain the shape of the intermediate sections and scaled appropriately • Psection = Pentry +(Pexit - Pentry) * β SAROD 2003
β(Lm/3) and β(2Lm/3) is specified β(x) β2 1 β1 0 x Lm/3 2Lm/3 Lm 0 Area Design Variables - 2 β variation is given by piecewise cubic curve as function of x A0 + A1x + A2x2 + A3x3 0 β < β1 B0 + B1x + B2x2 + B3x3 β1 β β2 C0 + C1x + C2x2 + C3x3 β2< β 1 β = SAROD 2003
Turbulence Modeling • Relevance: Time per Solution • Following aspects of the flow were of interest: • Boundary layer development • Flow Separation (if any) • Turbulence Development • Literature Survey • S-shaped duct • Circular cross-section • Doyle Knight, Smith, Harloff, Loeffer • Baldwin-Lomax model (Algebraic model) • Computationally inexpensive than more sophisticated models • Known to give non-accurate results for boundary layer separation etc. • Devaki Ravi Kumar & Sujata Bandyopadhyay (FLUENT Inc.) • k- realizable turbulence model • Two equation model SAROD 2003
Turbulence Modeling (contd.) • Standard k- model • Turbulence Viscosity Ratio exceeding 1,00,000 in 2/3 cells • Realizable k- model • Shih et. al. (1994) • Cμ is not assumed to be constant • A formulation suggested for calculating values of C1 & Cμ • Computationally little more expensive than the standard k- model Total Pressure profile at the exit section (Standard k- model) SAROD 2003
Results • Mass imbalance: 0.17% • Energy imbalance: 0.06% • Total pressure drop: 1.42% • Various turbulence related quantities of interest at entry and exit sections: y+ at the cell center of the cells adjacent to boundary throughout the domain is around 18. SAROD 2003
Flow Separation SAROD 2003
Flow Separation SAROD 2003