Download
1 / 36
390 likes | 888 Views
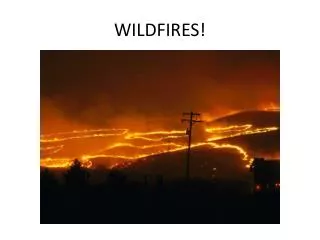
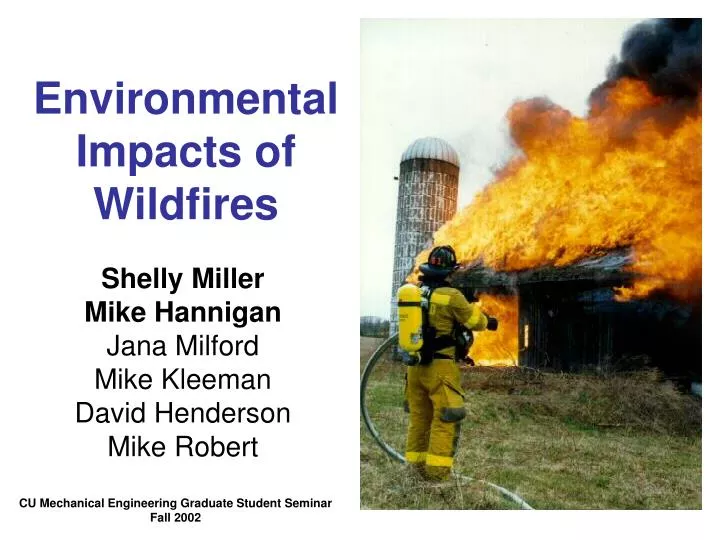
Environmental Impacts of Wildfires. Shelly Miller Mike Hannigan Jana Milford Mike Kleeman David Henderson Mike Robert. CU Mechanical Engineering Graduate Student Seminar Fall 2002.

E N D
Environmental Impacts of Wildfires Shelly Miller Mike Hannigan Jana Milford Mike Kleeman David Henderson Mike Robert CU Mechanical Engineering Graduate Student Seminar Fall 2002
Litter is preferentially composed of leaves and needles, which have less cell wall per unit mass and more surface area per unit mass. Plant surfaces are composed of the cuticle, which is a heterogeneous polymer of fatty acids, phenolics, long chain alcohols, fatty acid derivatives and odd-numbered n-alkanes. In addition, the N:C ratio is higher in leaves and needles so the ground fuel will have a relative emission of N. After a cell stops growing, the cell creates a secondary wall which gives the plant it’s rigid structure. To the right is a depiction of this secondary wall, minus the “glue” that fills the empty space. This “glue” gives wood it’s strength. During the growth stage, all plant cells form only a primary cell wall. The cell wall is composed exclusively of cellulose. The “glue” is a heterogeneous polymer termed lignin. Lignin monomers Cellulose is a linear polymer of glucose, which is a C6 carbohydrate (a.k.a., sugar). Duff has a higher percentage of the more stable plant components, such as metals. carbohydrate base Humus is more homogenous and has even higher ratios of metals. litter duff humus Fuel Molecular composition of a pine tree.
CO2 CO2 CO2 H2O CO2 CO2 CO2 CO2 CO2 CO2 CO2 H2O CO2 CO2 CO2 CO2 CO2 CO2 H2O heat H2O CO2 CO2 CO2 CO2 CO2 CO2 heat H2O H2O heat CO2 H2O H2O H2O H2O In the plume, the H2O vapor cools as the heat is lost. Some of this H2O will condense and grow rain drops. CO2 H2O complete combustion products Globally, CO2 emission from wildfires are 2-5 Pg/yr which is 30-80% of fossil fuel CO2 emission estimates. CO2, H2O, and heat CO2 emission rates measured in the plumes of wildfires range from 1.3-1.8 kg CO2 per kg fuel. CO2 is removed by reaction with OH (very slow) or by gradual partitioning into water drops that are rained out. The heat does work by making the plume rise. Thus, the heat is lost relatively quickly. CO2 has global effect. H2O has local/regional effect. Heat has only local effect.
O3 CO CO CO CH4 reduced N reduced N O3 other incomplete combustion products HC CO CO CH4 CO CO NOx O3 CH4 reduced N CO CH4 HC NOx NOx HC CO CO CO incomplete combustion products • Cause: • Lack of oxygen. • Complex fuels. • Poor heat transfer. Globally, CO emissions from wildfires account from 10 to 50% of total CO emissions. Nitrogen is key component of the nutrient cycle. Reduced nitrogen emitted from biomass burning is causing global redistribution of nitrogen. (from mostly tropical to global) trace gases CO, CH4, hydrocarbons, NOx, NH3, HCN, organic N VOCs acetaldehyde, acetone, methanol, vinyl acetate, … particles soot, minerals, organic mixtures CH4 is also a greenhouse gas, actually more efficient than CO2. Wildfire emissions account for 25% to almost all the total global CH4 emissions. Just as in urban areas, NOx and hydrocarbons (HC) react to form ozone. Due to biomass burning, O3 in the tropics is 30% greater than background CO emission rates vary with combustion condition, ranging from 5 to 25% of CO2 emissions. CH4 is very stable and only removed via oxidation by OH or O3. CH4 is global. CO and CO2 have similar removal mechanisms, except OH + CO is much faster. CO/CO2 ratios decrease slowly as a plume ages. Still, CO emissions have a large spatial scale effect. CO + CO2 emission account for 85 to 99% of wildfire carbon emissions.
incomplete combustion products particles 6 cities study looked at acute effect of exposure. More recently, researchers have seen correlations with fine particle levels and mortality for chronic exposure. Water drops come from condensing water vapor onto particle. We call the particles cloud condensation nuclei (CCN). A particles ability to act as CCN depends on the composition and size. The more CCN, then more cloud drops per cloud. The more cloud drops per cloud, the more the cloud scatters light. This will change the earth’s energy budget. Soot (black or light absorbing particles) are not excellent CCN; however, they still cause energy budget effects. They absorb incoming solar radiation, heating up the upper atmosphere but cooling the earth. 6 cities study flaming Mortality risk soot mass emission rate Fine particles smoldering total particle mass emission rate What matters: size and composition and amount
primary product pyrolysis Particle Composition Reported emission rates of levoglucosan from biomass combustion range from 2-12% of the particle mass. Other anhydrous sugars have been seen that correspond to constituents of hemicellulose and pectin, but not to the same degree. Lignin pyrolysis products also abound. • Prominent metals: • Potassium • Sulfur • Chlorine
Terpenoids Terpenoids are polymers with commonality of the same basic unit – isoprene. • Functionally and chemically diverse group of plant compounds. • Hormones • Oils and resins • Pigments • Sterols During wildfires, these terpenoids can be pyrolyzed and the products emitted or they can be directly emitted by volatilization.
Measure residential indoor and outdoor PM2.5 (particulate matter smaller than 2.5 m) while wildfire smoke is present Determine the effectiveness of recommended indoor exposure mitigation measures Keeping windows closed Using portable air cleaners Research Objectives Photo by: Bryan Day, Idaho, 2000
In the 1930s, 39 million acres burned naturally per year In the1980s 4.2 million acres burned per year (NIFS 2002) Cost of a prescribed burn ~$75/acre Cost of a wildfire ~$1000/acre (USFS 2002) Currently, the annual target for prescribed burns by 2005 is greater than 5 million acres (OAR 1998), compared to fewer than 700,000 acres burned from 1984–1994 (APCD 2000) History and Future of Fire
PM Measurements near Fires • In Hoopa Valley, CA 1999 PM10 levels exceeded 350 g/m3 for over a week and exceeded the EPA’s hazardous levels of 425 g/m3 for two days (Mott 2001) • In Hamilton, MT 2000 PM10 levels of 300–600 g/m3 were experienced during multiple days and during a 1-h period concentrations exceeded 999 g/m3 (Acheson, 2001; Ward and Smith, 2001) • In Indonesia, 1997 a 2-mo period of uncontrolled wildfires produced total suspended particles levels up to 15 times the established limit of 260 g/m3 (WHO, 1999).
Health Effects • Significant associations between outdoor PM concentrations during fires and health effects are: • increased hospitalization and visits to emergency room • increased respiratory symptoms • exacerbation of asthma • decreased lung function • These impacts have been observed primarily in the elderly, the very young and in individuals with pre-existing respiratory and/or cardiovascular illness (WHO, 1999; Mott 2001)
Experimental Design • Test the effectiveness of keeping windows closed and air cleaner operation on the indoor air quality • Locate wildfire producing smoke that will impact local residents • Identify and recruit two homes to be studied • Install air cleaners in one of the 2 homes • Monitor indoor and outdoor PM2.5concentrations at both homes during fire
Recruitment Methods • Fire located by monitoring local news and then contacting local forest service for hourly updates • When smoke would impact a populated location, equipment quickly loaded and taken to the area • Local fire department contacted for 2 sets of volunteers and CDPHE provided 2 sets • Homes of similar construction and age • Residents all nonsmokers and wood burning stoves not used • Residents told to keep all windows and doors shut and to record any activities which may introduce PM into the indoor environment • 2-3 air cleaners placed in one of the residence
Measurements • Indoor and outdoor 24-h average PM2.5 mass concentrations using Harvard impactors • Real-time indoor and outdoor particle # concentrations <0.5 m for 24 h using Climet optical particle counters • Air-exchange rate using CO2 tracer gas decay method
PRE-FILTER catches larger particles IONIZING CELL electrically charges particles when they pass through a powerful electric field COLLECTOR PLATES immediately attract "charged" particles ACTIVATED CARBON FILTER removes most common odors and fumes 3 tests performed on the air cleaners in a test chamber to measure Clean Air Delivery Rate (CADR) We measured an average CADR of 420 m3/h Agrees with CADR of 325-370 m3/h that is published by Association of Home Appliance Manufacturers Air Cleaners Friedrich C-90a Electrostatic Precipitator
Polhemus prescribed burn Burned all October 2001, producing heavy smoke on several days. Monitoring took place 10/20/01 to 10/21/01 when 2500 acres were ignited. Houses 1 and 2 were located 24 and 27 km north of this fire Schonover wildfireStarted by lightning on 5/21/02 and quickly grew to 2000 acres. Houses 5 and 6 were both located 24 km north of the fire. Monitoring took place 5/22/02 to 5/23/02. Ultimately the fire consumed 3800 acres and cost 2.4 million dollars to fight The Fires
4/24/02 5:30 PM 1800 acres (NOAA) The Fires • The Snaking wildfireBegan 4/23/02 behind Platt Canon High School. By 4/28/02 the fire consumed 2590 acres. Monitoring took place 4/25-4/26 11 km east of the fire.
The Biggest Wildfire in Colorado Recorded History!!! The Hayman wildfire 6/10/02 (NOAA) 11am-5pm.
The Fires The Hayman wildfire • Began 6/8/02, contained 7/2/02 • Consumed 137,760 total acres (67,700 in first two days), 133 residences, 1 commercial building, 466 out-buildings • Sampling during this fire was difficult because the smoke plume was energetic enough to rise to the upper atmosphere • Sampling took place on 6/10/02 with no results • A second trip was planned on 6/18/02. There was smoke impact the previous day in Denver. Similar atmospheric conditions were forecasted. Two houses were located in southern Denver located 47 km from the fire. This day was successful.
Data Analysis Impact of air cleaners: Impact of windows closed:
Polhemus Prescribed Burn24-h average PM2.5 (g/m3) Concentration in house 2 was 83% lower than in house 1 I/O ratio in house 1 was 50% lower than background I/O ratio Windows closed Error bars= data range 2 air cleaners Cooking event
Polhemus Particle Counts House 1 OPC, number of particles0.5-5.0 /m3 Model assumes: V=815 m3, =0.21 h-1
Snaking Wildfire • Measurements were made on two consecutive days in houses 3 and 4, May 25 and 26 2002 • On May 25th air cleaners were installed in house 4 • PM2.5 concentration in house 4 was 80% lower than in house 3 on May 25th • On May 26th air cleaners were moved to house 3 • On May 26th, house 3 was 62% lower than house 4
Hayman Wildfire24-h average PM2.5 (g/m3) Concentration in house 9 was 87% lower than in house 10 I/O ratio in house 10 was 21% lower than background I/O ratio Windows closed 3 air cleaners installed Error bars= data range
Hayman Wildfire Particle Counts House 9 OPC, number of particles0.5-5.0 /m3 Model assumes =0.17 h-1, V=510m3 3 air cleaners installed total CADR= 1260 m3h-1
Indoor PM2.5 Increases during Fires in Homes without Air Cleaners
Air Cleaners Reduce Indoor PM2.5 during Fires Results are valid, because homes have similar air exchange rates and indoor/outdoor background measurements
Keeping Windows Closed during Fires Reduces PM2.5 in Homes without Air Cleaners
Summary • Wildfires and prescribed burns caused an increase in indoor PM2.5 • Indoor levels increase to 57%-100% of outdoor concentrations when windows are closed • Air cleaners reduced indoor air PM2.5 by an average of 80% when compared to homes without air cleaners • Closed windows provided 18-50% reduction of indoor PM2.5 when compared to background • Indoor and outdoor background measurements were all similar and range between 3-5 g/m3.
Acknowledgments • US EPA Region 8 • Funding • US EPA Radiation and Indoor Environment Lab • Tri-county Health Department • Sampling Equipment • CDPHE • Gravimetric filter analysis • (Colleen Cambell) Information on weather, smoke movement, and access to volunteers • Boulder Fire Department, US Forest Service • Data on wildfires, and access to volunteers