Download
1 / 23
240 likes | 406 Views
Integrated Assessment Models of Economics of Climate Change. Economics 331b Spring 2009. The emissions-climate-impacts-policy nexus. Fossil fuel use generates CO2 emissions. Carbon cycle: redistributes around atmosphere, oceans, etc. Climate system: change in radiation warming,

E N D
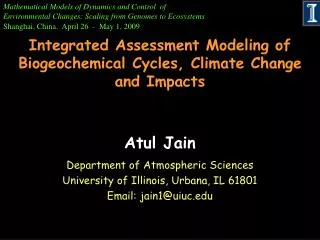
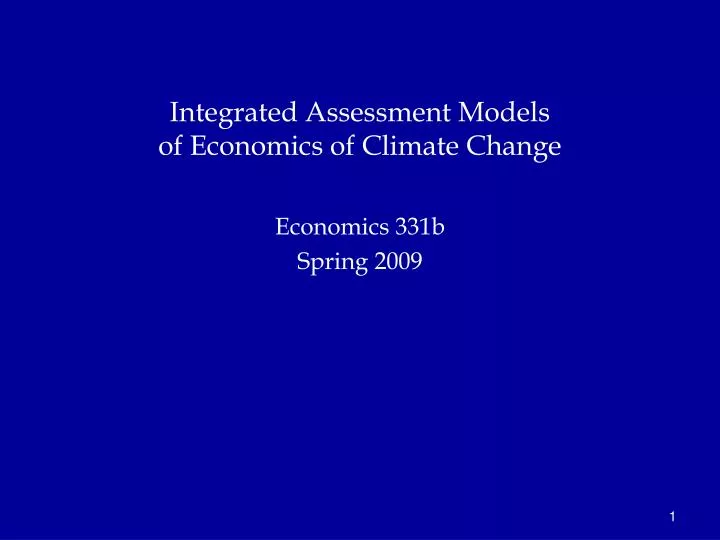
Integrated Assessment Modelsof Economics of Climate Change Economics 331b Spring 2009
The emissions-climate-impacts-policy nexus Fossil fuel use generates CO2 emissions Carbon cycle: redistributes around atmosphere, oceans, etc. Climate system: change in radiation warming, precip, ocean currents, etc.. Impacts on ecosystems, agriculture, diseases, skiing, golfing, … Measures to control emissions (limits, taxes, subsidies, …)
DICE and RICE models DICE: global aggregate (like Y-Econ models). Excel version as well as GAMS (math programming) version. Simple and transparent; reduced form modules. Latest full version 2007 in readings (Question of Balance) RICE: 12 regions Most recent version only Excel; earlier GAMS as well. Better regional resolution, but difficult to use and understand. Latest full version 2010 in readings (Proc Nat AcadSci US). (Both models available on my website DICE and RICE models.)
Screenshot of DICE: parameters DICE2010_091410b.xlsx
Reprise on computational complexity Climate models: Linear in NT (variables x time periods) Economic models (LP/DICE): Polynominal ≈ (NT)3 Choice of technologies/student travel/ backpack problem/: NP or ≈ 2NT
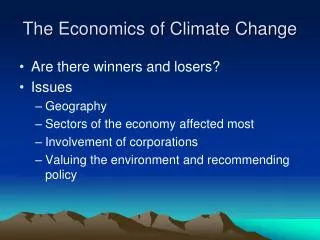
Scenarios for Analysis in RICE-2010 • 1. Baseline. No emissions controls. • 2. Economic cost-benefit “optimum.” Emissions and carbon prices to maximize discounted economic welfare. • 3. Limit to 2 °C. Climatic constraints with global temperature increase limited to 2 °C above 1900 • 4. Copenhagen, all countries. Uses US emissions targets joined by other rich countries, with developing countries entering after 1 -3 decades. • 5. Copenhagen, rich only. Uses US emissions reductions joined by other rich countries, with developing countries staying out.
Structure of policies Kyoto Protocol: Rich countries only, 7 percent average cuts, only for first “budget period”: 2008 – 2012. Minimal global cuts. Copenhagen Accord: Deep cuts for rich countries (see next slide for US). In principle, developing countries follow soon. Copenhagen, rich countries only: Same as Accord, with developing countries not participating till 2200. Key issue of whether have the “trade” in “cap-and-trade”
0 ) -1 Congressional r a e p r o p o s a ls y -2 r e p t n -3 e c r e -4 p ( h t w -5 o r G -6 -7 50 60 70 80 90 00 10 20 30 40 50 Rate of growth of CO2-GDP ratio: History and Congressional proposals
Structure of policies Assumption for Copenhagen Accord:
Structure of policies Assumption for Copenhagen Accord: Rich countries only
Carbon Price Actual equivalent global carbon price = $4/tC
Net impacts by region to 2050 of Copenhagen proposal with generous allocations to developing countries and full trading
Environmentalist critique Stern/Krugman critique* of the DICE model approach: • Uses too high a discount rate • Ignores the uncertainty and the “fat tail” of low-probability catastrophic outcomes • Uses a temperature sensitivity coefficient of 3 °C per CO2 doubling instead of more realistic 6 °C Next slide shows the sensitivity of the emissions control rate if we introduce these sequentially. Which are most important? *Stern Review : http://webarchive.nationalarchives.gov.uk/+/http://www.hm-treasury.gov.uk/sternreview_index.htm Krugman, “Building a Green Economy,” NYT Magazine, 2010, http://www.nytimes.com/2010/04/11/magazine/11Economy-t.html
From Science to Implementation • Understand the basic science • Weigh costs and benefits to determine a “reasonable policy ” for emissions, economic, and climate trajectory • Design an approach for translating the policy into actual steps (taxes, regulations, subsidies, …) • Negotiate both among nations (e.g., Copenhagen) and in national decision-making bodies (Congress, CCP, EU bodies,…)