Download
1 / 11
110 likes | 118 Views
This article explains how to organize data using a two-way frequency table and calculate relative frequencies. It includes examples and calculations.

E N D
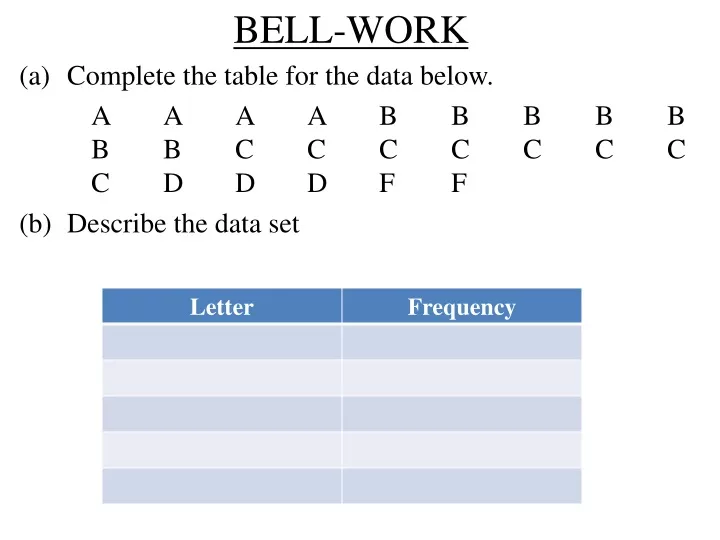
BELL-WORK (a) Complete the table for the data below. A A A A B B B B B B B C C C C C C C C D D D F F (b) Describe the data set
BELL-WORK (b)
Organizing Data Extending our table to include column frequency: A A A A B B B B B B B C C C C C C C C D D D F F
Organizing Data Extending our table to include relative frequency, round to the nearest percent if necessary:
Organizing Data Two-way Frequency Table A group of ice cream lovers were divided into two groups based on individual preferences. The results of the survey are displayed in the following two-way frequency table. Make a two-way relative frequency table for the data. (Leave your answers in fraction form).
Organizing Data Two-way Frequency Table A group of ice cream lovers were divided into two groups based on individual preferences. The results of the survey are displayed in the following two-way frequency table. Make a two-way relative frequency table for the data.
Organizing Data The athletic department at a local university offers summer sports camps for children. The following two-way frequency table shows the number of children that pre-registered for each sports camp. To the nearest percent, approximately what percentage of children pre-registered for soccer camp? ≈ 43%
Organizing Data A group of adults were surveyed regarding their favorite weekend activity. The results are shown in the two-way relative frequency table below. To the nearest percent, what percentage of adults who chose watching television as their favorite weekend activity are males? ≈ 70%
Organizing Data A survey of a company's employees explored the relationship between employee status and support of a new workplace safety policy. The results are displayed in the following two-way frequency table. What percentage of part-time employees support the new policy? 25%
Organizing Data Based on the table, which of the following statement(s) are true? A. There are twice as many part-time employees against the workplace safety policy than full-time employees against the workplace safety policy. B. There are more employees for the workplace safety policy than against the workplace safety policy. C. There is an equal number of part-time employees and full-time employees. • There are more part-time employees against the workplace safety policy than for the workplace safety policy.
Organizing Data We can calculate three types of frequencies from two-way tables: Joint frequencies Determine how many students are male and chose fruit as their favorite. 2 Marginal frequencies Determine how many students are male. 18 Conditional frequencies Determine what percent of males chose fruit as their favorite topping.