Download
1 / 11
110 likes | 126 Views
Explore the merging of graphical and symbolic representations in table visualization. Demonstration, study critique, strengths, weaknesses, comparison, and suggestions for the future are discussed.

E N D
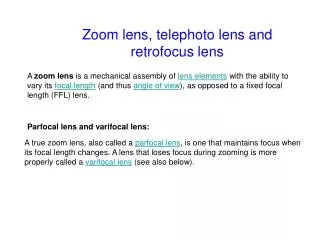
Table Lens • Paper – The Table Lens: Merging Graphical and Symbolic Representations in an Interactive Focus + Context Visualization for Tabular Information (Ramana Rao and Stuart K. Card) • Tool – Eureka by Insight.com • Presenter – Harsha K Rajasimha • Discusser – Vishal Nakra • Reader – You !!!
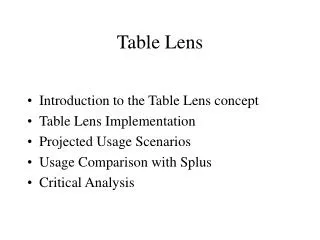
The Agenda • Overview First • The Underlying Concepts • Demonstration of the tool with sample data • Zoom in and filter • Describe/Critique Study and Conclusions • Strengths • Weaknesses • Comparison and future suggestions • User Tasks, Scale and HCI Metrics • Details on demand • Discussion
Underlying Concepts • “Focus+Context” or “Fisheye” technique • “Regularity Of Content” • Table • Lens - A magnifying glass without distortion • Context • Focus – Focal, Row focal, column focal, non-focal (Entire cells and no fragments) • focal data is textual • nonfocal data is graphical
DOI DOI DOI Slide Zoom Adjust Degree Of Interest (DOI) • Maps from an item to a value that indicates the level of interest in the item.
You Fool !!!Show Me The DATA !!!
Demo • Demo • 6 Factors – affect presentation type and usage • Value • Value type • Region type • Cell Size • User Choices • Spotlighting
Critique • Strengths • Supports Effective interaction with very large tables • Merges graphical representations directly into the process of table visualization and manipulation • Economical display of cell values • Ease of spotting/filtering patterns and features • Good for tabular and proportional data • Examining data for trends and relationships • Weaknesses • Not applicable to non-tabular data • Better ways of displaying textual values • Data entry • Large number of Attributes
Comparison and Future • Comparison • MS Excel – Can display 100 times more cells • A magnifying glass without distortion • A view of entire data on the screen • Easy to learn and use • Increased information density • How might it be improved ? • New ways of handling textual data • Add more focal levels • Allowing user input of records • Efficient ways of handling large number of attributes
HCI Metrics • User Performance - **** • Learnability – ***** • Error Rate - ***** • User Satisfaction - **** • Retention - ?????