Download
1 / 17
180 likes | 398 Views
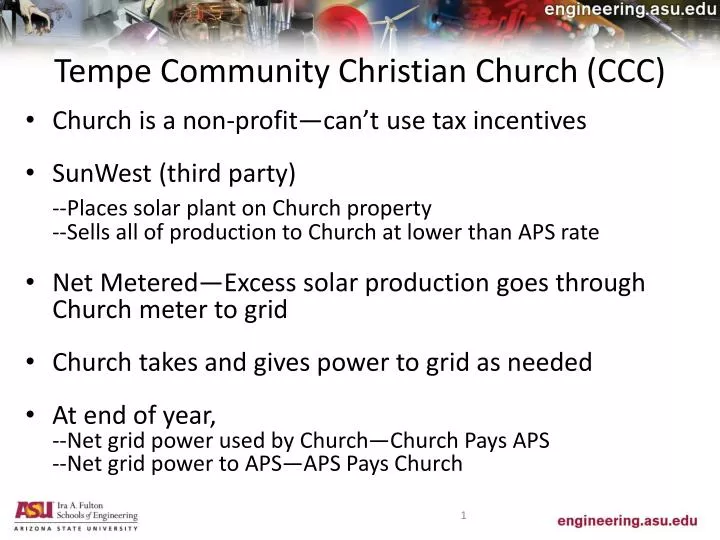
Tempe Community Christian Church (CCC). Church is a non-profit—can’t use tax incentives SunWest (third party) --Places solar plant on Church property --Sells all of production to Church at lower than APS rate Net Metered—Excess solar production goes through Church meter to grid

E N D
Tempe Community Christian Church (CCC) • Church is a non-profit—can’t use tax incentives • SunWest (third party) --Places solar plant on Church property--Sells all of production to Church at lower than APS rate • Net Metered—Excess solar production goes through Church meter to grid • Church takes and gives power to grid as needed • At end of year, --Net grid power used by Church—Church Pays APS --Net grid power to APS—APS Pays Church
Tempe CCC Solar SystemNet Metering Sun Grid Solar System SunWest Meter APS Meter Chuch Panel Church Electric Power Loads
Timeline • SunWest promises 25% decrease in electrical costs for the church • SunWest prepares contract and church board agrees • Trimble has not seen contract and puts together his best guess of the situation—Best case, CCC uses all of electricity generated and will have NPV savings of $32K over 20 years. • Trimble reviews contract and realizes that demand charge has not been considered. Church is paying SunWest 75% of 21.2 cents/kWh instead of the assumed APS rate of 12 cents/kWh
Timeline • SunWest determined rate by taking total APS Bill/total kWh used • Trimble issues analysis stating that church will loose about $5.3k the first year. This is based on analyzing the APS bill structure and realizing about 45% of bill is based on demand charges. Solar will not reduce peak demand. • Church loses over $6k the first year • Trimble gathers data from APS and confirms that peak occurs in the evening when solar is not available. • Church is attempting to recover losses and re-negotiate contract
Equations for CCC Savings Spreadsheet • IOC Yearly Solar Production, kWhe • Production Degradation, %/Yr • SunWest Rate, % of APS Sell Rate • APS Sell Rate, $/kWhe • APS Buy Rate, $/kWhe • APS Rate Escalator, %/Yr • CCC Usage, % of IOC Solar Production Given: • Production Degradation Factor = (1 + degradation per year) * number of years • Yearly Solar Production = IOC Yearly Solar Production * Prod Degradation Factor • Total CCC Usage = % of IOC Yearly Solar Production * IOC Yearly Solar Production • Energy Purchased from APS = Total CCC Usage – Yearly Solar Production • Energy Sold to APS = Yearly Solar Production – Total CCC Usage • APS Rates Escalation Factor = (1 + APS Rate Escalation) * number of years
Equations for CCC Savings Spreadsheet • Money Paid to SunWest = % of APS Sell Rate * APS Sell Rate * Yearly Solar Prod • Money Paid to APS = APS Sell Rate * Energy Purchased from APS • Money Received from APS = APS Buy Rate * Energy Sold to APS • Total Cost of Energy = Money Paid to SunWest • + Money Paid to APS • -Money Received from APS • Avoided Cost from APS = APS Sell Rate * Rate Escal Factor * Total CCC Usage • Yearly Savings = Avoided Cost of Electricity from APS – Total Cost of Electricity • Cumulative Savings = Prior Years Savings + This Year’s Savings • Present Value of Yearly Savings = Yearly Savings / ((1.04) Number of Years)
Equations for CCC Savings Spreadsheet • Cumulative Present Value Savings = PV of Prior Years Savings • + PV of This Year’s Savings • Savings Net Present Value = Cumulative Present Value Savings in Year 20
CCC Savings Spreadsheet
CCC Savings vs. Usage • Savings Decrease as Usage Decreases Below 100% • Usage Must be Greater than 80% of IOC Solar Output
CCC Case: Third Party Spreadsheet • Can take advantage of tax subsidies • Easier access to low-cost financing • Often production based incentive is used by utility to make solar financially attractive • Third party owns the equipment and sells power to the user • Third party takes the risk of supplying a reliable flow of energy
Analysis of APS Billing Rates See MS Word document provided to church