Download
1 / 38
380 likes | 884 Views
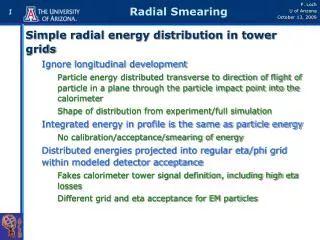
Radial DWD. Consider Training Data But What About Test Point In A Different Corner ???. Radial DWD. Approach: Replace Separating Plane With Separating Sphere Find Parameters Via DWD-like Optimization Enables Finding Corners With No Training Data. Virus Hunting.

E N D
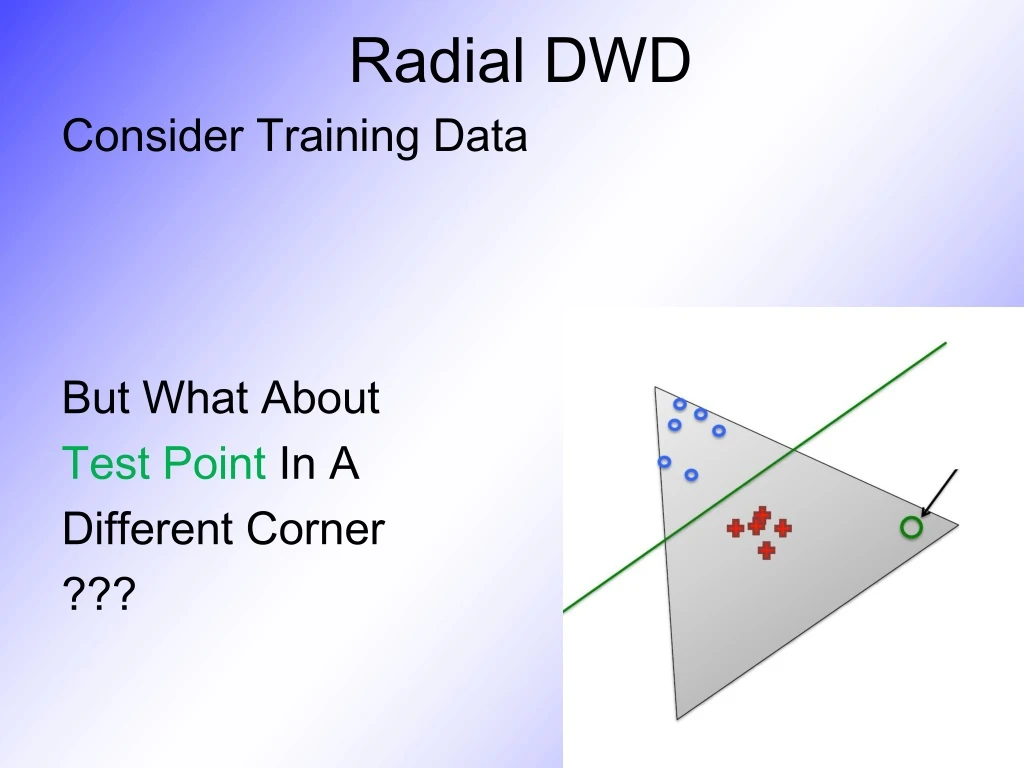
Radial DWD Consider Training Data But What About Test Point In A Different Corner ???
Radial DWD Approach: Replace Separating Plane With Separating Sphere Find Parameters Via DWD-like Optimization Enables Finding Corners With No Training Data
Virus Hunting Compare With Other Classifiers Even Kernel SVM Fails!!! Reason: Test Data Lies In Corners With No Training Data
ROC Curve Summarize & Compare Using Area Under Curve (AUC)
PCA to find clusters Recall Data Discovery in RNAseq Data (1/19/16)
PCA to find clusters PCA of Mass Flux Data:
PCA to find clusters Return to Investigation of PC1 Clusters: • Can see 3 bumps in smooth histogram Main Question: Important structure or sampling variability? Approach: SiZer (SIgnificance of ZERo crossings of deriv.)
Statistical Smoothing In 1 Dimension, 2 Major Settings: • Density Estimation “Histograms” • Nonparametric Regression “Scatterplot Smoothing”
Kernel Density Estimation Chondrite Data: • Sum pieces to estimate density • Suggests 3 modes (rock sources)
Scatterplot Smoothing E.g. Bralower Fossil Data – some smooths
Scatterplot Smoothing Interesting representation of local average: Given kernel window weights, Local Constant Least Squares Fit to Data:
Scatterplot Smoothing Interesting variation: Local linear fit to data: Given kernel window weights,
Scatterplot Smoothing Another variation: • “Intercept of Moving Polynomial Fit” • Window width is critical (~ k.d.e.)
Scatterplot Smoothing Local Polynomial Smoothing • What is best polynomial degree? • Once again controversial… • Advocates for all of 0, 1, 2, 3. • Depends on personal weighting of factors involved • Good reference: Fan & Gijbels (1995) • Personal choice: degree 1, local linear
Scatterplot Smoothing E.g. Bralower Fossils – local linear smooths
Scatterplot Smoothing Smooths of Bralower Fossil Data: • Oversmoothed misses structure • Undersmoothed feels sampling noise? • About right shows 2 valleys: • One seems clear • Is other one really there? • Same question as above…
Kernel Density Estimation Choice of bandwidth (window width)? • Very important to performance Fundamental Issue: Which modes are “really there”?
Kernel Density Estimation Choice of bandwidth (window width)? • Very important to performance • Data Based Choice? • Controversial Issue • Many recommendations • Suggested Reference: Jones, Marron & Sheather (1996) • Never a consensus…
Kernel Density Estimation Choice of bandwidth (window width)? • Alternate Choice: • Consider all of them! • I.e. look at whole spectrum of smooths • Can see different structure • At different smoothing levels • Connection to Scale Space • E.g. Stamps data • How many modes? • All answers are there….
Statistical Smoothing Fundamental Question For both of • Density Estimation: “Histograms” • Regression: “Scatterplot Smoothing” Which bumps are “really there”? vs. “artifacts of sampling noise”?
SiZer Background Scale Space– Idea from Computer Vision Goal: Teach Computers to “See” Modern Research: Extract “Information” from Images Early Theoretical work
SiZer Background Scale Space– Idea from Computer Vision • Conceptual basis: Oversmoothing = “view from afar” (macroscopic) Undersmoothing = “zoomed in view” (microscopic) Main idea: all smooths contain useful information, so study “full spectrum” (i. e. all smoothing levels) Recommended reference: Lindeberg (1994)
SiZer Background Fun Scale Space Views (of Family Incomes Data)
SiZer Background Fun Scale Space Views (Incomes Data) Spectrum Overlay
SiZer Background Fun Scale Space Views (Incomes Data) Surface View
SiZer Background Fun Scale Space Views (of Family Incomes Data) Note: The scale space viewpoint makes Data Dased Bandwidth Selection Much less important (than I once thought….)
SiZer Background SiZer: • Significance of Zero crossings, of the derivative, in scale space • Combines: • needed statistical inference • novel visualization • To get: a powerful exploratory data analysis method • Main references: Chaudhuri & Marron (1999) Hannig & Marron (2006)
SiZer Background Basic idea: a bump is characterized by: • an increase • followed by a decrease Generalization: Many features of interest captured by sign of the slope of the smooth Foundation of SiZer: Statistical inference on slopes, over scale space
SiZer Background SiZer Visual presentation: • Color map over scale space: • Blue: slope significantly upwards (derivative CI above 0) • Red: slope significantly downwards (derivative CI below 0) • Purple: slope insignificant (derivative CI contains 0)
SiZer Background SiZer analysis of Fossils data:
SiZer Background SiZer analysis of Fossils data: • Upper Left: Scatterplot, family of smooths, 1 highlighted • Upper Right: Scale space rep’n of family, with SiZer colors • Lower Left: SiZer map, more easy to view • Lower Right: SiCon map – replace slope by curvature • Slider (in movie viewer) highlights different smoothing levels
SiZer Background SiZer analysis of Fossils data (cont.): Oversmoothed (top of SiZer map): • Decreases at left, not on right Medium smoothed (middle of SiZer map): • Main valley significant, and left most increase • Smaller valley not statistically significant Undersmoothed (bottom of SiZer map): • “noise wiggles” not significant Additional SiZer color: gray - not enough data for inference
SiZer Background SiZer analysis of Fossils data (cont.): Common Question: Which is right? • Decreases on left, then flat (top of SiZer map) • Up, then down, then up again (middle of SiZer map) • No significant features (bottom of SiZer map) Answer: All are right • Just different scales of view, • i.e. levels of resolution of data
SiZer Background SiZer analysis of British Incomes data:
SiZer Background SiZer analysis of British Incomes data: • Oversmoothed: Only one mode • Medium smoothed: Two modes, statistically significant Confirmed by Schmitz & Marron, (1992) • Undersmoothed: many noise wiggles, not significant Again: all are correct, just different scales
SiZer Background E.g. - Marron & Wand (1992) Trimodal #9 Increasing n Only 1 Signif’t Mode Now 2 Signif’t Modes Finally all 3 Modes
SiZer Background E.g. - Marron & Wand Discrete Comb #15 Increasing n Coarse Bumps Only Now Fine bumps too Someday: “draw” local Bandwidth on SiZer map