Download

1 / 61
630 likes | 795 Views
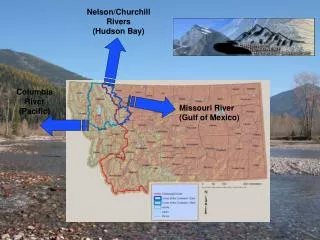
Radio Telemetry Studies of Adult Salmonids and Pacific Lamprey in the Columbia Basin. Chris Caudill University of Idaho Fish Ecology Research Lab Department of Fish and Wildlife Sciences Moscow, Idaho caudill@uidaho.edu http://www.cnr.uidaho.edu/uiferl/Archives.htm.

E N D
Radio Telemetry Studies of Adult Salmonids and Pacific Lamprey in the Columbia Basin Chris Caudill University of Idaho Fish Ecology Research Lab Department of Fish and Wildlife Sciences Moscow, Idaho caudill@uidaho.edu http://www.cnr.uidaho.edu/uiferl/Archives.htm
Radio Telemetry Studies of Adult Salmonids and Pacific Lamprey in the Columbia Basin Chris Peery, Ted Bjornn, Matt Keefer, Charles Boggs, Bill Daigle, Tami Clabough , Megan Heinrich, Mike Jepson, Steve Lee, George Naughton, Rudy Ringe, Ken Tolotti, Lowell Struenberg, Mary Moser, Ben Ho, Brian McIlraith, Dan Joosten, Karen Johnson, Ryan Mann, Eric Johnson, Mark Morasch, Travis Dick, Rose Poulin Brian Burke, …
Talk outline • Radio telemetry background: RT in the multi-scale toolbox • Specific case studies • General approach • Adult salmonids • Adult Pacific lamprey
Spatial Scale of Investigation • Short scale/local (specific structures, behavior; 1-10 m spatial scales) • Optical video • DIDSON Video • PIT evaluation (specific antennas) • Acoustic telemetry w/ 3D receiver array • Meso-scale (fishways, habitat use, individual dams; 10m - km spatial scales) • Radio or Acoustic • (PIT) • Large-scale evaluations (escapement, distribution, straying, etc. 10-1000s km) • Radio or Acoustic • (PIT)
Tag effects Corbett et al. 2012 NAJFM http://dx.doi.org/10.1080/02755947.2012.700902
Tag effects • Corbett et al. (2012). Tagged spring Chinook salmon in upper Yakima River (Roza Dam, Yakima rkm 208; Columbia rkm 745), held in raceways.
Willamette ValleyFall Creek (Columbia R. rkm 503) Table 7. Final estimated fates of Chinook salmon that were PIT-tagged or double-tagged (PIT and radio-tagged) in Fall Creek, 2008-2011. Double-tagged fish were only included in the PIT-tagged numbers if the whole carcass was recovered, and not just the radio tag in 2008-2010. Double-tagged and radio-tagged fish were enumerated separately in 2011. From Naughton et al. 2012.
Columbia River tag effects Mainstem unaccounted for losses ~ 12% ~ upper limit -unreported harvest -death (including tag effects) -tag failure / loss -does not account for delayed effects in tribs (Keefer et al. 2005) Known tag loss ~2.2-4.0% (Keefer et al. 2004) Travel rates similar between RT and unhandled PIT tagged adults (Matter and Sanford 2003). Keefer et al. 2005
Radio Telemetry Summary • Medium to large spatial scales • Tracking individuals through acoustically noisy environments (e.g., spillways, fishways) • Single receiver gates • External antenna • Tag life ~ battery size ~ tag size ~ tag effect • Spatial resolution to ~ 10 m • Tag effects important in some systems, particularly when tagging late in migration
Case Examples: Adult salmonids • General approach • Local scale questions • Behavior • Evaluations of fishway improvements • Temperature effects • Spawning success in tributaries • Reach scale questions • Run-timing • Conversion rates • Temperature effects • Post-project passage migration • Transport and straying
Bonneville Dam Chinook Salmon Tagging 2010 Tagging early in run, in contrast to Corbett et al. 2012
Monitoring arrays 4 Lower Columbia dams 4 Lower Snake dams Priest Rapids, Wanapum
Monitoring arrays 4 Lower Columbia dams 4 Lower Snake dams Priest Rapids, Wanapum Major tributaries ≥ 147 Receiver Sites / yr Mobile Tracking Multi-antenna rec’vs at dams Single antenna rec’vs at other sites
Bonneville Dam Chinook Salmon Tagging Proportional tagging useful for expansions, sampling all stocks
Pacific Lamprey Sample sizes driven by balance of precision needed for question(s), costs, and potential negative impacts on resource.
Data Management and Availability • Generates very large datasets (millions of records) • Data processing, filtering, and coding of behaviors (SQL server, custom scripts) • Long term database stored at UI and NMFS • Challenging to convert to a (useful) open source database • Code definitions and interpretations of detections • Interannual comparisons complicated by changes in site locations, etc. • Most use of coded database by researchers
Local scale questions • Do modifications negatively affect adult salmonid passage? • Dam structures • Dam operations (tailrace conditions, fishway operations), or • Fishway improvements
Monitoring modifications and improvements (Local to Mesoscale)
Monitoring modifications and improvements for Pacific lamprey Variable width weir LPS
Example Passage Metrics Before-After-Control-Impact (BACI) Design PASSAGE RATE/NUMBERS 1) Entrance Efficiency = the proportion of fish entering of those that approached (Entrances/approaches) 2) Exit Ratio = the proportion of fish exiting to the tailrace of those that entered (Exits/entrances) PASS BEHAVIOR (DELAYS ~ energetic cost; sea lion predation) 3) Entrance Time = Time from first fishway approach to first entrance 4) Entrance to Base of Ladder = Passage time from first entrance to the transition pool 5) Extended passage time = Percentage of adults with passage time > 1 hour
Cascades Island vs. Bradford IslandSpring Chinook Conclusion: Short-term effect in year after installation, diminished in second year (“seasoning” effect?)
Temperature effects: Individual to Population ScaleLinking environmental experience to movement • What is the thermal experience of adults • How does temperature affect behavior? • Behavioral thermoregulationat tributaries • At dams? • Temperature and survival • Climate change? • Temperature and energetics and prespawn mortality
Temperature effects: Individual to Population ScaleLinking environmental experience to movement • Steelhead body temperatures reflect extensive holding in cool-water tributaries with large diel fluctuations in temperature • Behavioral thermoregulation and flexible migration rate • Increased vulnerability to fisheries take in tributaries (High et al. 2006).
Summer Stratification and Ladder Temperatures Exit Temperature Dam Fishway Junction Pool Temperature Tailrace Forebay
Ladder Passage Time A B B A B B A A B A A A Different letters indicate contrast P < 0.025
80 Unaccounted (n=100) Pfate<0.001 25 Successful (n=388) 60 20 Number of sockeye salmon 40 Temperature at Bonneville (ºC) 15 20 0 10 1 June 15 June 1 July 15 July 1 Aug 15 Aug Tagging Date at Bonneville Population Effects: Sockeye Salmon 1997 Early Entry Late Entry
Willamette Valley PSM Condition/ Disease Status PSM Environmental Factors Energetic Status/Timing Keefer et al. 2010
Adult salmonid reach-scale questions: • Run-timing • Escapement rates • Post-project passage migration success • Delayed effects of transport on migration success, behavior and straying
Chinook salmon migration timing and stock composition Date at Bonneville Dam Keefer et al. 2004 (NAJFM) Jepson et al. 2004 (NAJFM) Back assignment of unmarked adults using final locations
Escapement data Fisheries in lower reservoirs Increase for upstream Reaches Esc1 uncorrected for fisheries take Esc2 Fisheries take in tribs considered successful Esc3 All fisheries take considered successful Keefer et al. 2005
Across scales: Delayed effectsSpring Chinook at Bonneville Dam 2002 Caudill et al. 2007
Dam Passage Time & Fate Mechanism remain uninvestigated
? HOME Barging and straying • Does barging juveniles affect adult behavior?
Juvenile migration “route” and adult migration Adults use reverse sequence Spawning Marine Growth In-river Barge Sequential imprinting during juvenile outmigration
Metrics • Migration timing and rate • Route, especially fallback • Fate • Successful (reached spawning trib) • Unaccounted • Fisheries returns (reward program) • Known-source groups: • Stray? • Barged as juveniles or in-river outmigration?
Barging and straying Keefer et al. 2008 (EA)
Barging and straying “Early right turn” suggests effect of barging on the recall rate or timing of imprinted cues near tributary-mainstem confluence
Why it matters: Straying effects on small wild populations Figure 14. Examples of the proportions of adult strays that spawn with a local recipient population (strays/(strays+natives) as estimated using four recipient population sizes (four panels: 500, 1,000, 5,000, or 10,000 fish), a range of donor population size (0-200,000), and three donor stray rates: 1% (solid line), 3% (dotted line), and 5% (dashed line). Small recipient populations can be numerically dominated by strays when the donor population is large, even when stray rates are low. (Note: same as Figure 1). From Keefer and Caudill 2012.
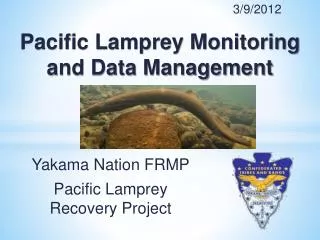
Adult Pacific lamprey • General passage behavior and patterns • Dam passage • Hydrosystem passage • Local-scale evaluations • Identifying bottlenecks • Evaluating structural and operational modifications • Tag effects • Cautionary note
Modifications for Pacific lamprey Velocity
Upstream escapement: among-year comparison HDX only: from release Relatively consistent patterns among years All radios: from release
Distribution: 185 radio-tagged lampreys that passed BON Last detections: 2009 Tributaries = 13% Main stem sites = 87%Reservoirs= 41% Tailrace and fishway= 46% 2% PRD 1% IHD Klickitat R 2% 1% 3% MCN JDA 31% 5% 15% TDA 14% 15% BON John Day R Deschutes R