Download
1 / 27
270 likes | 294 Views
Dive into the U.S. trucking industry's growth, composition, and operations. Learn about market trends, primary commodities, and the rise of intermodalism. Explore the impact of deregulation and the industry's key players. Understand the significance of export trucking and the nuances of truckload and LTL operations, including equipment types and intermodal strategies. Stay informed on the latest trends and developments shaping the future of freight transportation in the U.S.

E N D
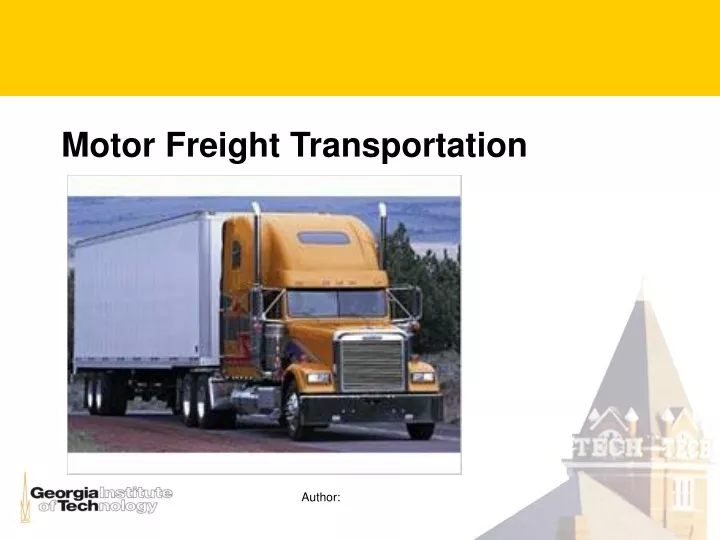
Motor Freight Transportation Author:
U.S. Trucking Industry • Exclusively serves 70% U.S. Communities • Employees: 9.6 million • Truck drivers: 3 million • Local and Over-the-Road [OTR] • Fuel: 29 billion gallons diesel per annum • Miles traveled: 428 billion • 116 billion by Class 8 vehicles
US Deregulation: Motor Carrier Act (1980) • History • Regulation began 1935: Interstate Commerce Commission • Strong railroad lobby • Certificated carriers for specific routes: trafficking • Removal of barriers to entry • Relaxed contract carriage rules • Results • Route restructuring • Market competition and decreased prices • Enabling of new services: intermodal • Enabling of modern lean manufacturing
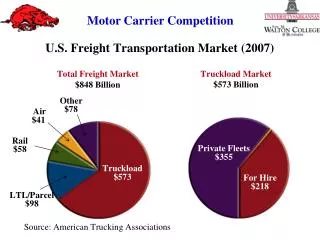
U.S. Trucking Industry Growth • Increasing in importance • Freight transport revenue share • 68% in 1960 • 81% in 1997 • Continuing growth • Lean supply chains; just-in-time • Ecommerce • Primary beneficiaries: Parcel, LTL, Air freight
Examples: ranked by 1998 revenue • Truckload firms • Schneider National (3), J.B. Hunt (7), Swift (14), Werner (15) • Less-than-truckload firms • Yellow (2), Roadway (4), Consolidated Freightways (5), Con-Way (8), ABF (9), Overnite (11), American Freightways (12) • Household goods firms • United Van Lines (10), North American (13)
Dominant revenue producers • Electronics, instruments, vehicles: $953MM, 55% share • Base metals and machinery: $831MM, 80% share • Wood products, textiles, leathers: $764MM, 78% share • Furniture and other manufactured products:$601MM, 77% share • Grains, alcohol, and tobacco: $556 MM, 93% share • Pharmaceutical and chemical products: $546 MM, 74% share
Export trucking • Grown in importance with NAFTA • Trend: Mexican manufacturing facilities • 20% of export freight revenue • 11% of export tons • Primary commodities: • Electronics, instruments, vehicles: $49 MM • Base metal and machinery: $23MM • Gateways: Laredo, El Paso, San Diego
Truckload operations • Direct origin-to-destination service • No equipment changes • No intermediate terminals required • General vs. specialized • Refrigerated vans (“reefers”), automobile transports, grain carriers • Planning issues • Supply-demand balancing (backhauls, empty repositioning) • Driver issues (relays, home stays)
Less-than-Truckload (LTL) operations • Small shipments • 250 to 12,000 lbs. • Cube (volume) is usually constraint on vehicle packing • Hub-and-spoke networks • Consolidation and rerouting role of terminals • Planning issues • Network design • Routing and scheduling problems
Equipment types in fleets • Single-unit trucks: 68% • Delivery vans, tank trucks, dump trucks, cement mixers • Tractor-semitrailer combination: 26% • Often, “18-wheelers” • Lengths (US): 40 to 53 foot • Multi-trailer combinations: 6% • STAA doubles: twin 28’ trailers • Longer combination vehicles: Rocky Mt Doubles, Turnpike Doubles, Triples
Intermodalism • Economics • Can be slower • Origin and destination drayage • Huge cost savings in driver pay • Long-haul trips • 500-700 miles • Hub-to-hub trips in LTL and package express trucking • TOFC vs. COFC • Equipment investment and management vs. price
TOFC • Trailer-on-flatcar • 28’ Highway trailers
Trends • Value-added • Tracking and tracing, online quotes and service requests • Dedicated contract carriage • Replacement for private carriage: outsourced • Time-sensitive transportation • Expedited options: FAST • Time-definite delivery: RELIABLE • 3PL Services • Warehousing, distribution management, handling