Download
1 / 19
190 likes | 375 Views
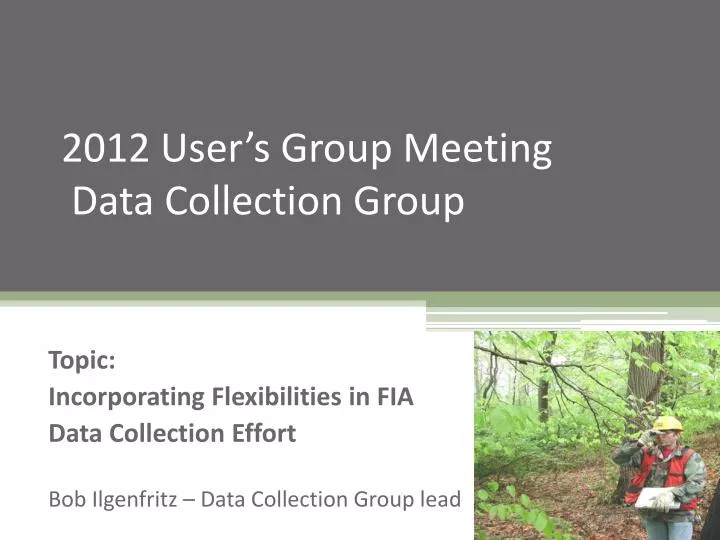
2012 User’s Group Meeting Data Collection Group. Topic: Incorporating Flexibilities in FIA Data Collection Effort Bob Ilgenfritz – Data Collection Group lead. Need for Greater Flexibility:. Responsive to Budget fluctuations: Increasing/decreasing or flat

E N D
2012 User’s Group Meeting Data Collection Group Topic: Incorporating Flexibilities in FIA Data Collection Effort Bob Ilgenfritz – Data Collection Group lead
Need for Greater Flexibility: • Responsive to Budget fluctuations: • Increasing/decreasing or flat • Responsive to new natural resource priorities or issues: • Carbon/Biomass/Urban/Others
Five FIA Flexibility Tools: • Subpaneling • Interpenetrating subsampling of subpanels • Subsampling within plots • Level of attribution sampling • Temporal cycle lengths
Definitions • Panel – A complete set of FIA plots completed in a state in a year. • Subpanel – A equally proportional subset of a cycle with spatial distribution of plots across a state • Cycle –The total of all plots in a state • Sub-cycle – Number of subpanels (plots) done per year
Subpaneling • Each state’s panel is subdivided into 70 subpanels with roughly equal numbers of plots in each subpanel. • Why 70 subpanels? • 10 year cycle in west and 7 year cycle in east with option to buy down to 5 year cycle. • 5 year cycle = 14 subpanels/yr. • 7 year cycle = 10 subpanels/yr. • 10 year cycle = 7 subpanels/yr. • Decreased budgets - Completing fewer subpanels per year increases cycle length and decreases the number of plots done per year • Increased budgets - Completing more subpanels per year decreases cycle length and increases the number of plots done per year
Interpenetrating subsample of subpanels – P3 and P2+ plots • Panel 70 subpanels subsample of each subpanel • Predetermined sample % • Assure that subsample of subpanel is spatial too • Subsample % of total plots is constant regardless of the cycle length • Past • P3 – 1 of every 16 FIA plots is a P3 plot • Current • P2+ - 1 of every 8 FIA plots is a P2+ plot
Interpenetrating subsample of subpanels • Future? • Increase P2+ subsample size from 1 in 8 to: • 3 in 16 – 3 X P3 sample • 1 in 4 – 4 X P3 sample • Subsample size based on protocol type and respective window: • Soils – Frost free soils window • DWM - Snow free window • Vegetation/Invasives/Regeneration – Leaf on window
Subsampling within plots • Not currently in use but: • We could sample protocols or individual data items on a subsample of the subplots, microplots or macroplots. • Examples: • Protocols: • Veg/DWM/Invasives/Crowns on fewer than all 4 subplots • Advanced Seedling Tree Regeneration on fewer than all 4 microplots
Level of attribution sampling • Down Woody Materials: • Base – captures volume, biomass, carbon, and fuel loads • Wildlife/ecological data - Base plus additional CWD structural variables for wildlife habitat (P3 protocols) • Rapid assessment – customized protocol designed for disturbances Hurricanes, volcanoes, etc. • P2 Vegetation Profile: • Level of Detail 1– Vegetation structure • Level of Detail 2 – Veg structure plus understory species composition • Level of Detail 3 – Level of detail 2 plus overstory species composition • P3 Veg – Botanist identifies all veg species on sample plot
Temporal Cycle Length • Remeasurement cycle relative to protocol’s potential for change. • Less potential for change - longer remeasurement cycle • More potential for change – shorter remeasurement cycle • Example: • Soils and current 10 years remeasurement. Results of first remeasurement may indicate need for longer cycle length.
2012 User’s Group Meeting - Data Collection Group Topic: P2+ November 27, 2012
P3 Redesign in Summer 2012– What is “P2 +” • Leaf on “Window” Plots and an expansion of the P3 Sample: • Carbon, Biomass, Vegetation Structure, Invasives, Wildlife, Fuel Loads, and Tree Regeneration • Interpenetrating Sample of FIA Sub Panels • Flexible and Consistent Sampling Percentages Regardless of Cycle Length • Designed to Meet Data Collection Business Models • Including Contractors and One Person Crews • Less Detailed Data / Greater Sample Size • Better suited for FIA’s strategic sample-based inventory
P2+ Protocols • Crown Dieback and Uncompacted Crown Ratio • Base Down Woody Material (DWM) • Vegetation Structure by Growth Habitat • Invasive Plants • ASTR - Advanced Seeding Tree Regeneration • Soils on P3 sample
Pros to P2+ • More plots for less or similar costs • More plots mean greater sample size, finer resolution data, and greater utility to more users. Better meets the needs of a strategic inventory. • Cost savings helped re-initiate FIA ecosystem indicators -DWM lite, Veg lite, Invasives, Crowns lite, regional protocol ASTR, and Soils.
P2 +Sample Size Implementation Schedule • Summer 2012 – Double P3 Sample • 1 of every 8 plots or 12.5% • Summer 2013 – Same sample size as 2012 • Evaluate time study from last summer. • Identify P2+ protocols that are outliers • Redesign protocols if necessary
P2+ Data • P2 Vegetation • Vegetation by growth habitat • Tally trees • Non tally trees • Shrubs/Vines • Graminoids • Species composition ?????
P2+ Data • P2 DWM protocols – Down Woody Material • Captures volume, carbon, biomass, and fuel loading • Crowns • Uncompacted crown ratio • Die back