Download
1 / 8
80 likes | 233 Views
2-Year Trend Resident Pupil Counts (Oct 1st 2003 to Oct 1st 2004). 0% or greater. 0% to -1%. * Does not include unorganized territories. -1% to -2%. -2% or greater. 5-Year Trend Resident Pupil Counts (Oct 1st 2000 to Oct 1st 2004). 0% or greater. 0% to -4%.

E N D
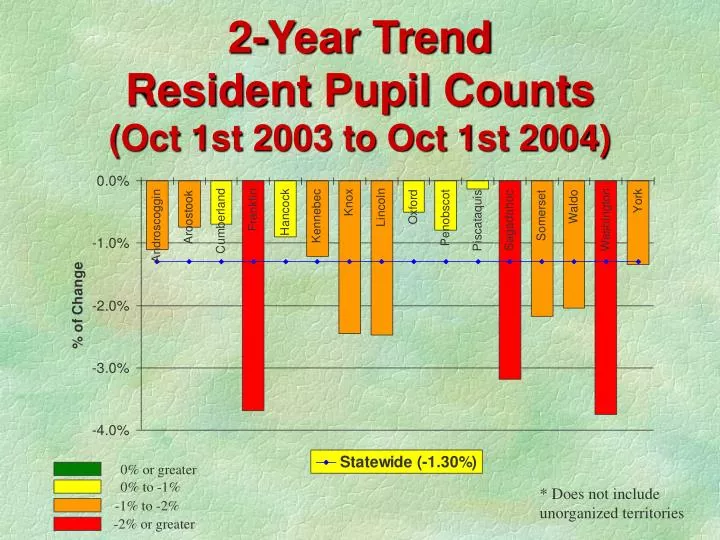
2-Year TrendResident Pupil Counts(Oct 1st 2003 to Oct 1st 2004) 0% or greater 0% to -1% * Does not include unorganized territories -1% to -2% -2% or greater
5-Year TrendResident Pupil Counts(Oct 1st 2000 to Oct 1st 2004) 0% or greater 0% to -4% * Does not include unorganized territories -4% to -8% -8% or greater
10-Year TrendResident Pupil Counts(Oct 1st 1995 to Oct 1st 2004) 0% or greater 0% to -10% * Does not include unorganized territories -10% to -20% -20% or greater
2-Year TrendResident Pupil Counts(Projected Oct 1st 2005 to Oct 1st 2006) 0% to -2% -2% to -4% * Does not include unorganized territories -4% or greater
5-Year TrendResident Pupil Counts(Projected Oct 1st 2005 to Oct 1st 2009) 0% to -6% -6% to -12% * Does not include unorganized territories -12% or greater
10-Year TrendResident Pupil Counts(Projected Oct 1st 2005 to Oct 1st 2014) 0% to -10% -10% to -20% * Does not include unorganized territories -20% or greater
October 2004Resident Pupil Counts(Individual Grade Count) * Does not include unorganized territories Trendline
Resident Pupil Counts1970 to 2003 Actual2004 to 2017 Projected * Does not include unorganized territories Actual Trendline Projected