Download

1 / 18

E N D
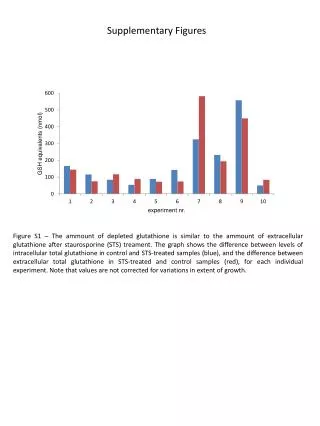
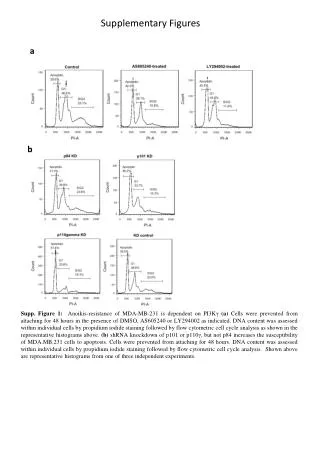
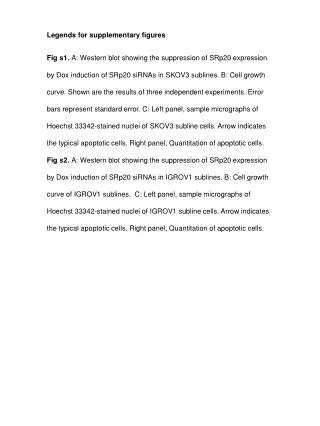
Figure Legends Suppl. Figure 1. Flow cytometry analysis to monitor apoptosis levels in MCF-7 cells. As control MCF-7 cells grown in complete media were stain just with IP (1st graph) or double stained (IP and Annexin V). 2 μM of Doxorubicin was used as a positive control of apoptosis. Results are shown after treating the cells with doxorubicin in the presence or absence of FBS. The kinetics experiment after serum-deprivation shows an overall increase in apoptosis with increasing time in serum-free media. Suppl. Figure 2. IHC detection of secretome proteins in both normal breast tissue and breast cancer tissue obtained from Protein Atlas database. In each case, one normal breast tissue and three different breast tumors are shown.
Suppl. Figure 1 Complete media only IP staining Complete media + doxorubicin Serum-free media + doxorubicin 0h Serum-free media 84.14% 14.60% 2.02% 0.09% 84.39% 14.83% 0.35% 1.65% 0.39% 1.57% IP+ IP+, A+ IP-, A- 1.20% 0.06% 1.41% 0.70% 0.08% 96.54% 1.46% 96.48% 97.53% 0.51% Complete media 0.33% 2.31% 1.35% 2.48% 0.19% 1.57% 0.18% 1.31% 0.78% 1.97% 95.52% 1.85% 95.45% 0.71% 97.35% 0.88% 97.52% 1.00% 95.30% 1.96% 72h Serum-free media 96h Serum-free media 24h Serum-free media 6h Serum-free media 48h Serum-free media
Suppl. Figure 2 CTGF