Download
1 / 37
370 likes | 470 Views
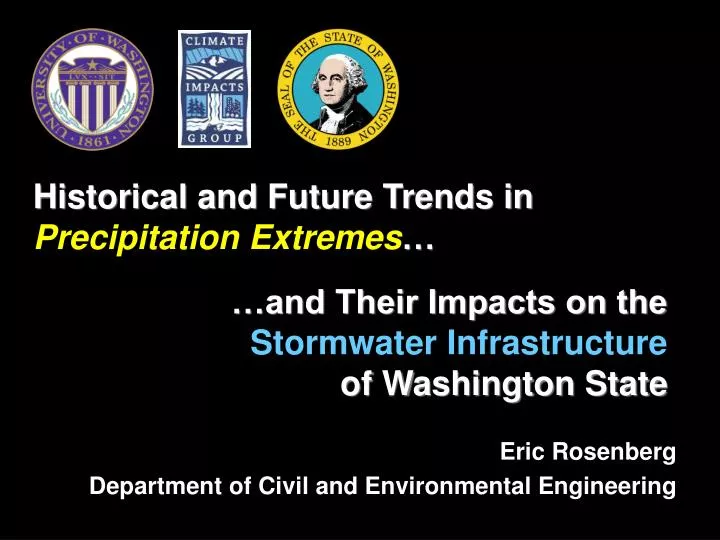
…and Their Impacts on the Stormwater Infrastructure of Washington State. Historical and Future Trends in Precipitation Extremes …. Eric Rosenberg Department of Civil and Environmental Engineering. Introduction. House Bill 1303. Passed spring 2007. Assessed impacts of climate change on:

E N D
…and Their Impacts on the Stormwater Infrastructure of Washington State Historical and Future Trends in Precipitation Extremes… Eric Rosenberg Department of Civil and Environmental Engineering
House Bill 1303 • Passed spring 2007 • Assessed impacts of climate change on: ▫ Agriculture ▫ Human Health ▫ Coasts ▫ Salmon ▫ Energy ▫ Water ▫ Forests ▫ Urban Stormwater Infrastructure
JANUARY 12, 2009 JANUARY FLOODS Disaster Declarations Federal Emergency Management Agency disaster declarations in King County in connection with flooding: January 1990 November 1990 December 1990 November 1995 February 1996 December 1996 March 1997 November 2003 December 2006 December 2007 When disaster becomes routine Crisis repeats as nature’s buffers disappear Lynda V. Mapes
Stationarity “A time series is stationary if it is free of trends, shifts, or periodicity, implying that the statistical parameters of the series (e.g., mean and variance) remain constant through time.” Salas 1993, Handbook of Hydrology
Urban Stormwater Infrastructure • Minor Infrastructure • Roadside swales, gutters, and sewers typically designed to convey runoff events of 2- or 5-year return periods. • Major Infrastructure • Larger flood control structures designed to manage 50- or 100-year events. Urbonas and Roesner 1993
Objectives • What are the historical trends in precipitation extremes across Washington State?2. What are the projected trends in precipitation extremes over the next 50 years in the state’s urban areas?3. What are the likely consequences of future changes in precipitation extremes on urban stormwater infrastructure?
Historical Precipitation Analysis
Literature Review • Several studies have found increases in the frequency of extreme precipitation events throughout the US over the last 100 years. • Two main drawbacks with prior research: • 1. Not focused on sub-daily extremes most critical to urban stormwater infrastructure • 2. Not focused on changes in event intensity most critical to urban stormwater infrastructure
Regional Frequency Analysis • Used by Fowler and Kilsby (2003)to determine changes in design storm magnitudes from 1960 to 2000 in the United Kingdom • Based on principle that annual precipitation maxima from all sites in a region can be described by common probability distribution after site data are divided by their at-site means. • Larger pool of data results in less variable estimates of design storm magnitudes, particularly for longer return periods.
Precipitation Distributions at SeaTac Change in Average Annual Maximum = +25% +37% +30%
Results of Historical Analysis Changes in average precipitation annual maxima between 1956–1980 and 1981–2005: * * Statistically significant for difference in means
Statistical Significance • General indication of how likely a sample statistic is to have occurred by chance. • A statistically significant result indicates that we are at least 95% confident that the meansof the underlying populations are not equal. • A statistically significant result does NOT imply that the means of the underlying populations are different by the same amount as the difference in the sample means, only that they are different by SOME amount.
Future Precipitation Projections
Emissions Scenarios Economic Global Regional Environmental
Emissions Scenarios Nakicenovic and Swart 2000
Global Climate Models ECHAM5• Developed at Max Planck Institute for Meteorology (Hamburg, Germany) • Used to simulate the A1B scenario in our studyCCSM3• Developed at National Center for Atmospheric Research (NCAR; Boulder, Colorado) • Used to simulate the A2 scenario in our study
Global Climate Models ECHAM5 CCSM3 Mote et al 2005
Dynamical Downscaling Global Model Regional Model Courtesy Eric Salathé
Results of Future Analysis Changes in average precipitation annual maxima between 1970–2000 and 2020–2050: * * CCSM3 ECHAM5 * * * Statistically significant for difference in means
Future Runoff Simulations
Bias Correction and Statistical Downscaling Overview: Bias Correction • Performed at the grid point from each simulation that was closest to SeaTac Airport• Bias corrected data used to drive hydrologic modeling of Thornton Creek (Seattle) and Juanita Creek (Kirkland) watersheds.
Bias Correction and Statistical Downscaling Overview: Bias Correction • Despite biases in modeled data, projections may still prove useful if interpreted relative to the modeled climatology rather than the observed climatology.• Performed separately for each calendar month.
Bias-Corrected Time Series (CCSM3/A2) 2003 2007 2006 PREDICTION CALIBRATION
Bias-Corrected Time Series (ECHAM5/A1B) PREDICTION CALIBRATION
Results of Hydrologic Modeling Changes in average streamflow annual maxima between 1970-2000 and 2020-2050: * * * Statistically significant for difference in means
The November Surprise JAN FEB MAR APR MAY JUN JUL AUG NOV SEP OCT NOV DEC Courtesy Eric Salathé
Conclusions • Few statistically significant changes in extreme precip have been observed in the last 50 years, with the possible exception of the Puget Sound. • Simulations generally indicate increases in extreme magnitudes throughout the state over the next 50years, but their projections vary by model and region, and actual changes may be difficult to distinguish from natural variability.• Hydrologic modeling of two urban creeks in the Seattle area suggest overall increases in peak annual discharge over the next 50 years.
What the Study Does Not Address • Projections from the other 2 families of scenarios or the other 20+ global climate models • What percentage of past trends was due to climatechange and what percentage was due to climatevariability • The relative influence of changes in land use or more complex climate-related phenomena (e.g., rain-on-snow events) on future runoff
What Do We Do Now? • Insufficient confidence in future projections to recommend changes to design standards right now • Regardless of climate change, our stormwater infrastructure is currently underperforming and in need of improvement and repair • Low Impact Development strategies are likely to be most practical, economical, and effective options • Accounting for future increases in runoff is still a matter of risk. For large capital projects, robust cost-benefit analyses can determine the most efficient use of money over the projects’ intended design lives.
Acknowledgements • Dennis LettenmaierDepartment of Civil and Environmental Engineering • Anne SteinemannDept of Civil and Env Eng, Evans School of Public Affairs • Derek Booth Stillwater Sciences, Dept of Civil and Env Engineering • Patrick Keys Department of Civil and Environmental Engineering • David HartleyNorthwest Hydraulic Consultants • Jeff Burkey King County Division of Water and Land Resources
Acknowledgements • Climate Impacts Group • Washington State Legislature • Washington State Department of Ecology • Seattle Public Utilities