Download

1 / 59
600 likes | 791 Views
Multiple Indicator Cluster Surveys Data Interpretation, Further Analysis and Dissemination Workshop. Mortality. Background. Mortality during the first five years of life – broken down by age segments and calculated as probabilities… but still called “rates”

E N D
Multiple Indicator Cluster SurveysData Interpretation, Further Analysis and Dissemination Workshop Mortality
Background • Mortality during the first five years of life – broken down by age segments and calculated as probabilities… • but still called “rates” • Infant (first one year) & under-5 mortality rates (first 5 years) are the most commonly calculated probabilities – the two MDG indicators
Conventional Data Sources • Vital registration • Population censuses • Surveillance systems, sample registration systems • Household surveys: • Birth histories: Direct estimates (DHS and MICS surveys) • Indirect estimates also possible • Summary birth histories: Indirect estimates (MICS and other household surveys)
Direct estimation • Based on birth histories • Required data • Date of birth for all children born (month and year) • Survival status • Date or (more frequently) age at death for each child who has died • Birth cohorts are retrospectively reconstructed and a synthetic cohort life table approach used to estimate indicators
Methods: Direct method • Rely heavily on the quality of information collected – works best in populations where • dates and durations are well-known, • data is collected with well-trained interviewers and good field supervision • Sources of errors: • Omission of births and deaths • Misreporting of age at death (age heaping at 12 months is common) • Birth misplacement
Methods: Direct method Check DQ tables to identify data quality issues in birth histories
At time t’, cannot calculate the probability of dying for cohort born between t and t’ during ages a and b Lexis diagram of birth cohorts and exposure Possible to take into account exposure of those born between t-b and t-a, as well as truncated exposure of those born between t’-b and t’-a
Check unweighted numbers: • Do not show indicator if less than 250 in any segment covered • Parenthesize if 250-499 Exposure at beginning of each interval
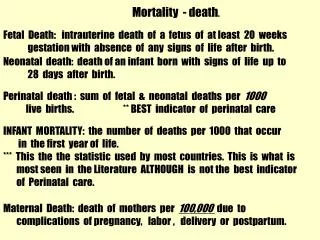
Example: Calculation of infant mortality rate Infant mortality is the probability of dying during the first year of life We need to calculate the probability of surviving until the end of the first year of life, and subtract this from 1.0
Example: Calculation of infant mortality rate • The probability of surviving until the end of the first year of life is (1 - 0.02515) * (1 – 0.00732) * (1 – 0.01127) * (1 – 0.01795) = 0.939633 And the probability of dying is (1 – 0.939633) = 0.06037
Final (published) table We can use the mid-points of each period and show these estimates on a graph to see trends
Plotting mortality rates Survey date
Indirect estimation: Age version • Required data: • Age of women • The total number of children ever born by women • The total number of children who have died (or, the number who are still alive) • Requires the same information as the direct method, with the exception of dates of birth and ages at death – only aggregate numbers
Indirect estimation: Age version • Distributes children ever born to women retrospectively over time using mathematical models • Assumptions: • Little or no change in fertility levels & age patterns • No change or a linear decline in mortality • A pattern of mortality by age that conforms to known model life table “families” which basically derived from European experience
Distribution of children born to women in each age group by the number of years since birth
Indirect estimation: Age version Converts proportion dead of children ever born D(i) reported by women in age groups 15-19, 20-24, etc. into estimates of probability of dying before attaining certain exact childhood ages, q(x): q(x) = K(i)*D(i) where the multiplier K(i) is meant to adjust for non mortality factors determining the value of D(i)
Indirect estimation: Age version • The age pattern of child mortality (Select the right model life table) • Coale-Demeny patterns by region: East, North, South, and West • United Nations patterns by region: Latin America, Chilean, South Asian, Far Eastern, and General
Indirect estimation: Age version Check unweighted denominators for each age group - numbers of children ever born
Plotting mortality rates Survey date As the “final” or “most recent” estimate, we use an average of estimates based on women age 25-29 and 30-34 These estimates are not used as they are based on predominantly first births and births to adolescents
Indirect estimation: Time since first birth version • Required data: • Date of first birth for each woman (or number of years since first birth) • The total number of children ever born by women in each time since first birth group • The total number of children who have died among these children (or, the number who are still alive) • “Age groups” are replaced by “Time since first birth groups”
Indirect estimation: Time since first birth version • Generates estimates that are closer to the survey date • “Selection bias” less pronounced • Uses data better (5 groups as opposed to 7) • Distribution of births by time since first birth occur within narrower time intervals
Plotting mortality rates Survey date Used as the “final”, “most recent” estimate – however, analysis ongoing on whether this number is also subject to selection biases
MICS5 and mortality estimation Majority of surveys now including birth histories, which allows direct estimation From these surveys, direct estimates are generated and presented, but indirect estimates should also be produced (for checking data quality) When direct estimates are available, does not make sense to publish indirect estimates as well
MICS5 and mortality estimation If birth histories are not included, generate both age and time since first birth (TSFB) versions Interagency group recommends the use of the TSFB version – a very recent development Produce and compare both versions, decide which one will be used based on objective technical evaluation (sample sizes, patterns, out of range values, fluctuations)
MICS5 and mortality estimation Mortality estimates (both direct and indirect) are subject to relatively wide confidence intervals Need to calculate sampling errors Recently developed program (CMRJack) used to calculate sampling errors – will be adopted to MICS programming
Data quality issues in indirect estimation • Main errors in data on children ever born and children dead/surviving • Omission of deaths • Misreporting of women’s age or TSFB • Other drawbacks • Many assumptions • Use of models and applicability • Can only provide “rough” estimates (level and timing) – not sensitive enough to showing changes over short periods of time
For further analysis Compare estimates from different sources Analyze mortality by coverage indicators Check age patterns of mortality (from direct method), compare with model patterns Multivariate analyses