Download
1 / 33
330 likes | 542 Views
Applying Nutrient Standards in Wadeable Streams in Montana. Vicki Watson, University of Montana Michael Suplee, Montana DEQ Presented at Nitrate in Montana Hydrologic Systems, Helena, MT April 23, 2014.

E N D
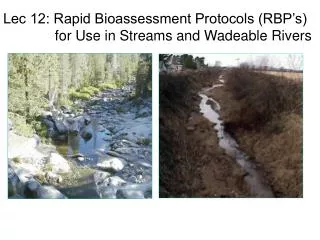
Applying Nutrient Standards in Wadeable Streams in Montana Vicki Watson, University of Montana Michael Suplee, Montana DEQ Presented at Nitrate in Montana Hydrologic Systems, Helena, MT April 23, 2014
Excess nutrients & nuisance algae –one of top 5 causes of impairment of Montana’s wadeable streams 17% of MT impaired stream miles impaired by excess nutrients Cladophora in Clark Fork River, 1980s
MT Numeric Nutrient Criteria In 2008, DEQ developed preliminary ecoregion-specific numeric criteria for nutrients and algae, based on regional stressor-response studies and reference-stream data for mountains and plains ecoregions (Level III) Harm to beneficial uses began around: • 90th percentile of reference in mountains • 75th percentile of reference in plains • So criteria were set near these levels
How were the 2008 Criteria Derived? • Based on nutrient concentrations where impact to these sensitive beneficial uses begins to occur • Fish and aquatic life • Recreation & aesthetics • Impact-to-use thresholds determined using: • Stressor-response studies (e.g., TN vs. DO) • Public opinion surveys on nuisance algae levels • Final criteria derived by: • Comparing impact threshold concentrations to ecoregional reference data
<25 100 (Summer mean) 50 mg chlorophyll a per square meter 150 (Summer max) >500 >250 35g AFDW per square meter
Stressor-response Studies vs. Reference-site Data (in contrast to EPA’s suggestion of using the 25th percentile of all streams)
Level III Ecoregions & Stream reference sites (white) Cities (red dots)
MT’s Draft Level III Ecoregion Nutrient Criteria, 2008 In addition to N and P criteria, attached-algae criteria were suggested for western mountainous ecoregions. Plains criteria set to maintain acceptable DO levels. Note seasonality. .
In 2012, MT nutrient criteria were refined, in light of: additional stressor response studies additional reference site data Made it possible to look at small scale level-IV ecoregions within some Level III ecoregions Greater emphasis was placed on dose-response studies, and criteria were no longer linked to specific percentiles in the reference distribution
N:P Ratios also Considered Nuisance growths of Didymosphenia (rock snot) noted in low P streams with high N:P ratios (N:P 34:1) Nuisance growths of Cladophoranoted in high P streams with low N:P ratios
Didymo Distribution U.S. EPA. Retrieved 2007-07-16.
Level III Ecoregions & Stream reference sites (white) Cities (red dots)
Level IV ecoregion within Middle Rockies: Absaroka-Gallatin Volcanic Mountains
Middle Rockies (17) TN criteria 300 µg/L (93th percentile of reference) TP criteria: 30 µg/L (80th percentile of reference) N:P Ratio of Criteria: 10:1 N:P Ratio of Reference Sites: 11:1 Absaroka-Gallatin Volcanic Mountains (17i) TN criteria 250 µg/L ( >100th percentile of reference) TP criteria: 105 µg/L (75th percentile of reference) N:P Ratio of Criteria: 2:1 N:P Ratio of Reference Sites: 1:1
Middle Rockies Stream Bloody Dick Creek
Gardner River Absoroka-Gallatin Volcanic Mountain Streams E. Rosebud Cr.
NW Glaciated Plains (gray), Mountain-to-plains transition zone level IV ecoregions (dark gray)
Northwestern Glaciated Plains (42) Total Nitrogen: 1,300µg/L (65th percentile) Total Phosphorus: 110 µg/L (75th percentile) N:P Ratio of Criteria: 12:1 N:P Ratio of Reference Sites 18:1 Mountain-to-plains transition zone (various) Total Nitrogen: 560 µg/L (80th percentile) Total Phosphorus: 80 µg/L (75th percentile) N:P Ratio of criteria: 7:1 N:P Ratio of Reference Sites: 7:1
Porcupine Cr. Northwestern Glaciated Plains Streams Battle Cr.
Transitional Stream Clear Creek, Flowing down From the Bear Paw Mountains on to the Glaciated Plains
Northwestern Great Plains(gray), Wyoming Basin (light gray). Mountain-to-plains transition zone level IV ecoregions (dark gray)
Northwestern Great Plains (43) Total Nitrogen: 1,300µg/L (68th percentile) Total Phosphorus: 150 µg/L (77th percentile) N:P Ratio of Criteria: 9:1 N:P Ratio of Reference Sites 13:1 Mountain-to-plains transition zone (various) Total Nitrogen: 440 µg/L (98th percentile) Total Phosphorus: 33 µg/L (87th percentile) N:P Ratio of criteria: 13:1 N:P Ratio of Reference Sites: 13:1
Northwestern Great Plains Streams Box Elder Cr. O’Fallon Cr.
Most Streams Already Meet the Criteria Based on probabilistic stream survey: • About 70-80% of stream miles statewide currently meet the TP criteria • About 85-90% of stream miles statewide currently meet the TN criteria
Reach Specific Criteria used where naturally elevated nutrients (e.g., due to geology) from a level IV ecoregion affect reaches downstream in another ecoregion. Acceptable downstream concentrations are estimated from relative contribution of sources in the two ecoregions.
Allowable Exceedence Rate for Criteria • Criteria are not “no sample shall exceed” • EPA recommends 10-25% exceedence rate for most types of criteria (303(d) listing guidance) • A 9-year dataset on MT’s Clark Fork River shows • Sites with consistent nuisance algae – 54% of N and P samples exceed criteria • Sites without nuisance algae – only 6% of N and P samples exceed criteria • 25% exceedence appears to be a threshold. Above that, nuisance algae very likely. Recommend: 20% allowable exceedence rate
MT draft numeric nutrient standards were out for public comment until April 1st. See Circular DEQ-12A Recent hearing before MT BER
Application of Proposed Nutrient Standards Examples: discharge from existing permitted source where: A. Discharge is directly to stream, stream is on the 303(d) list for nutrients B. Discharge is directly to stream, stream is not on the 303(d) list for nutrients and C. Discharge of effluent is to groundwaterwith hydrologic connection to surface water (if no connection, only groundwater standards apply)
A. Stream is on the 303(d) list for nutrients • Stream already exceeds nutrient standards so standards are to be met at end-of-pipe (July-Oct) • If cost prohibitive/technologically infeasible, permittee can apply for a variance: • > 1 MGD: 1 mg TP/L, 10 mg TN/L • < 1 MGD: 2 mg TP/L, 15 mg TN/L • Lagoons: Maintain performance/monitor • Variance applies for up to 20 years, but stricter treatment requirements over that period are likely • Other, case-specific variances also available
B. Stream is not on the 303(d) list for nutrients • Dilution in mixing zone based on stream’s ambient nutrient concentrations and the seasonal 14Q5 flow from July to Oct • Seasonal 14Q5 flow = lowest average 14 consecutive day low-flow (July-Oct) occurring once every 5 years, on average • Nutrient standards met end-of-mixing zone • Variance can be requested if calculated limit is still cost prohibitive
C. Discharge to groundwater with hydrologic link to surface water • Discharge permit written to meet surface water nutrient standards at the 14Q5 flow, after mixing • Volume of discharge and post-mixed groundwater concentration are mixed in with 14Q5 flow • Monitoring occurs end-of-pipe even though discharge is to groundwater • Likely to be written for year-round application • Nutrient variance can be requested (if limits are still cost prohibitive) because nutrient surface-water standards are being applied
Thanks. Questions? vicki.watson@umontana.edu (406) 243-5153 msuplee@mt.gov (406) 444-0831