Download
1 / 81
810 likes | 1.07k Views
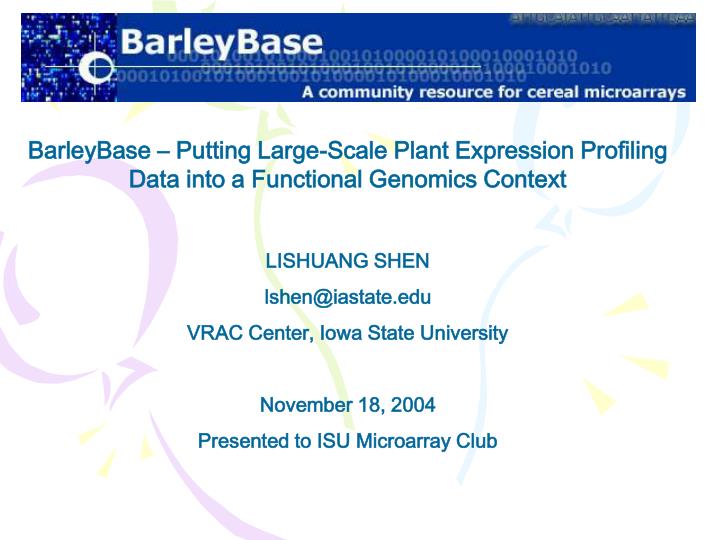
BarleyBase – Putting Large-Scale Plant Expression Profiling Data into a Functional Genomics Context LISHUANG SHEN lshen@iastate.edu VRAC Center, Iowa State University November 18, 2004 Presented to ISU Microarray Club. In this talk

E N D
BarleyBase – Putting Large-Scale Plant Expression Profiling Data into a Functional Genomics Context LISHUANG SHEN lshen@iastate.edu VRAC Center, Iowa State University November 18, 2004 Presented to ISU Microarray Club
In this talk I will focus on the data and tools we have for biologists to analyze and interpret large scale gene profiling data. My talk will leave out most technical details of data formats, database schema and implementations.
Terms to Know Array/Chip/Hybridization: A collection of probes on glass encased in a plastic cartridge. Exemplar: The contig or singleton sequences used to design probe sets from. Usually representing a gene. Probe: A 25-mer oligonucleotide designed to be complementary to a reference sequence. The probe sequence that is complementary to the sequence to be hybridized. Probe Set: A collection of probe pairs which interrogates the same sequence, or set of sequences. A probe set typically contains between 11 to 20 probe pairs. Probe Pair: Two features within a probe set. Each probe of a probe pair is designed to differ only at the nucleotide base interrogation position. The probe pair is designed to detect a Perfect Match (PM) and a Mismatch (MM). Mismatch Probe (MM): A 25-mer oligonucleotide designed to be complementary to a reference sequence except for a single base (13th) change to complementary base to the original at the position. Mismatch probes serve as specificity controls when compared to their corresponding Perfect Match (PM) probes.
What is BarleyBase • What’s BarleyBase • BarleyBase (www.BarleyBase.org) is a USDA-funded public repository for plant microarray data. • What’s Stored in BarleyBase • MIAME-compliant experiment and sample annotations. • Both raw and MAS5 or RMA normalized expression data. • Affymetrix GeneChips supported. Spotted cDNA/long-oligo array being added. • Sequence Annotations. • Precomputed expression statistics. Quality control measures. • What’s the Data Source for BarleyBase • Original submissions from investigators. • Shared microarray data from NASCArray, TAIR, TIGR and GEO. • Gene annotations from Affymetrix, Gramene, HarvEST, PlantGDB, TAIR, TIGR. NCBI, EBI, KEGG.
What is BarleyBase • How BarleyBase Capture MicroarrayData • BarleyExpress is the web-based, MIAME-compliant, experiment submission tool for BarleyBase. • How BarleyBase Present Microarray Data • Data query and display options at all data levels, from experiment, hybridization to probe set and probe levels. • Probe set queries are seamlessly integrated with analysis & visualization tools. • How BarleyBase Help in Interpreting Microarray Data • In-house annotation of uncharacterized GeneChip exemplars • FuncExpression for classification & comparison of genes. • FuncExpression for retrieval expression by functional classes. • Collaboration with PlantGDB, Gramene and GrainGenes to perform gene prediction and cross-species comparison
What is BarleyBase • Implementation • Built on open-source tools or tools free for academic institutions. • The server uses RedHat Linux version 9 OS. • The website is powered by an Apache server, PHP and Javascript, and a MySQL 4.0 relational database as the back end. • The data processing and visualization use R, Bioconductor, and Perl.
Current Status of BarleyBase • BarleyBase is now among the largest plant microarray data repositories: • 28 experiment submissions, • 1,067 hybridizations. • 450 Barley1 GeneChips • 569 Arabidopsis ATH1 or AG GeneChips • 48 Maize pilot GeneChips. • 6 Affymetrix Plant GeneChips: Barley1, Arabidopsis ATH1 and 8K AG, Maize Pilot, Soybean, grape. • 8 Protocols. • Full set of data accessing, mining and meta analysis tools for plant microarray data. • Better than many microarray databases do: GEO, ArrayExpress … • All data has raw CEL files, for users to try other normalization methods.
Current Status of BarleyBase Usage Statistics for www.barleybase.org
BarleyBase Data Acquisition & Processing • Submitters submit experiment and expression raw data. • BarleyBase pre-process and normalizes submitted raw data. Methods are MAS 5 and RMA. • Pre-Compute summary statistics and graphs for raw and normalized expression data. • Load all types of data into MySQL database. • BarleyBase assigns unique accession numbers to experiments, hybridizations & samples. • BarleyBase generates MAGE-ML and CSV files for batch download and for data exchange. • Experiment and associated data ready for online access and analysis.
BarleyBase MySQL DB+ Files Data Processing Pipeline Batch Download MAGE-ML Raw Data CSV BarleyExpress Query, Analysis & Viz. MAS5.0 RMA Internet User BarleyBase Data Flow
BarleyBase Data Model • BarleyBase organizes microarray gene expression data in hierarchical data model. • Six table types: Array, Expression, Experiment, Protocol, Submitter, Annotation. • Follows MIAME principles recommended by MGED, tuned for plants, and removes the Extract level. • Added statistical experimental factorial design factors fields. • Enforcing plant ontology and controlled vocabulary in experiment description. • Biological annotation for probe sets and exemplars with Gene Ontology.
BarleyBase Hierarchical Data Model Experiment Experiment Factor Treatment4 Treatment1 Treatment2 Treatment3 Sample Treatment Protocol Sample 1…n Sample 1…n Sample 1…n Sample 1…n Hn H1 H2 Hn Hn Hn H1 H2 H1 H2 H1 H2 Extraction/Labeling/Hyb/Washing/Scanning protocol Raw Expression Intensities for Hybridisations Normalization protocol Normalized Expression Data
Experiment Design Source (e.g. Taxonomy) Gene Sample Array Design Data MIAME – Minimum Information About a Microarray Experiment www.mged.org Publication 6 parts of a microarray experiment Hybridisation Normalisation
Six Parts of MIAME • Experimental design: the set of hybridization experiments as a whole. • Array design: each array used and each element (spot, feature) on the array. • Sample: samples used and extraction preparation and labeling. • Hybridizations: procedures and parameters. • Measurements: images, quantification, and specifications. • Normalization controls: types, values, and specifications.
BarleyBase Data Access Policy • Password - secured and flexible account and data access management • Data owners specify accessibility modes to protect their data before publication and yet enable dispersed collaboration. • Accessibility modes to experiment data • Publicaccess - allows any users to access data; • Private access - data can be viewed only by the data owner; • Group access - allows group members to access the data. • Users can create groups and add selected users to the groups to grant access to data from designated experiments. • Manuscript Reviewers can anonymously access data sets referenced by a to verify the conclusions using reviewer’s login ID. • All users are encouraged to make their data public as soon as possible.
BarleyBase Experiment Submission • Our online submission tool is BarleyExpress. It is based on MIAMExpress which is used by ArrayExpress for online submission. • BarleyExpress captured all the information from MIAME guidelines that is relevant to plants. • Experiment, Sample, Array, Protocol submissions • Uses controlled vocabulary/Ontology wherever possible • BarleyBase joins effort with Gramene and TAIR in utilizing plant ontology. • BarleyExpress additionally explicitly capture factorial experimental design. • BarleyExpress is fast and easy to use. Most submissions takes just 1~2 hours to finish. • Using batch data file upload • Reuse of template experiment and sample information
BarleyExpress - Web-Based Submission Steps • Submitters first input experiment design information. • 2. Annotate experiment in factorial design with factor names and levels. • 3. Batch upload raw GeneChip data files. • 4. Associate raw data files with each studied treatment. • 5. Protocol submission – optional. • 6. Input sample preparation details for each hybridization. Use templates to reuse previous sample submissions. • 7. Finalize experiment submission. • 8. Submitters grant access to designated individuals and groups. • New User Need to be Registered with BarleyBase before Making any Submission
Online Data Access at BarleyBase • Batch download complete data sets for experiment annotation, raw and normalized expression data in MAGE-ML, comma-separated values (CSV), or CEL-file formats. • Navigate experiments, hybridizations, samples and exemplars at BB. • Gene list creation, management & analysis for gene-centric analysis. • Data are protected by password. • Submitter controlled access to their submitted data.
BarleyBase Data Analysis Flow • Part I. Array-Centric Analysis • Search for Experiments • Data Evaluation and Quality Checking at Hybridization and Experiment Level. • Part II. Gene-Centric Analysis • Create Gene List by Expression Profiles or Functional Annotations • Management and Manipulation of Gene Lists • Adv. Analysis (Pattern Recognition) and Visualization of Gene Lists • Part III. Gene-Centric Analysis- Interpretation • Functional Interpretation with GO, Pathway, Gene Family, InterPro etc.
Part I. Experiment Searching, Quality Checking and Visualization of Hybridizations
Step 1. Search Experiment http://www.barleybase.org/query_experiment.php
Step 4. View Summary and Quality Checking for its Hybridizations http://www.barleybase.org/expsummary.php
Visualization at Experiment Level – Raw Intensities and Normalized Expression values • Boxplot of raw PM intensities: Showing change in raw PM intensity distribution for different hybridizations. Colored by treatment. • Boxplot of RMA expression values: Showing change in RMA expression value distribution for different hybridizations. Colored by treatment.
Step 4. Visualization at Experiment Level – Raw Perfect Match (PM) Intensities 1. Density plot of raw PM intensities: Showing the change in raw PM intensity distribution for different hybridizations. 2. RNA digestion plot with raw PM intensities: Showing the raw PM intensity change with regard to probe pairs location from 5' to 3'. Aids in identifying abnormality in labeling efficiency by position.
Step 5. Visualization at Hybridization Level – Chip Image of PM Intensities The pseudo image helps visualize probe signals across chip surface. Aids in finding abnormality during hybridization, washing etc..
Step 5. Visualization at Hybridization Level – Chip Image of PM Intensities A not so good slide has an artifact spot (arrow)
Step 5. Get Customized Scatterplots and MvA Plots The x- and y- axis can be from any treatments or hybridizations, even from different experiments
Step 5. Visualization at Hybridization Level – Scatterplots of Normalized Expression values Data is log2 scaled, thus a difference = 1 equals 2-fold change, the lines or colors represent 2-, 4- and 8-fold changes. Numbers of changed genes are shown as legends.
Annotation for a Barley1 GeneChip Exemplar Sequence One exemplar may be used to design several probe sets
Align Barley1 Exemplar on japonica Rice Genome Browser at Gramene
BB4_H17 BB4_H18 2000 pm 2000 pm mm mm 1500 1500 Probe Intensity Probe Intensity 1000 1000 500 500 0 0 0 1 2 3 4 5 6 7 8 9 10 0 1 2 3 4 5 6 7 8 9 10 Probe Pair Number Probe Pair Number Barplot for Probe PM and MM Raw Intensities from a Probeset
Part II. BarleyBase Gene-Centric Data Analysis Flow • The Gene-Centric Data Analysis are Organized in a Project Fashion. • Steps: • Creation of Gene List – Probe Set Filtering/Searching • Management of Gene Lists. • Advanced Analysis of Gene Lists • Management of AdvancedAnalysis Results • Functional Interpretation of Gene Lists
Flowchart for Gene-Centric Data Analysis Co-Expressed Genes Analysis & Visualization Expression2Function Knowing exemplar or probe set name Gene List (Probe Set List) Import Gene List Knowing sequence description keyword Probe Set Keyword Query Exemplar Details (Annotation, Seq., BLAST, Links to Analysis in BB, PlantGDB & Gramene) Knowing probe set expression Stat. Test Fold Change Absolute Value & Variation Probe Set Details (Stat. Profile Plot, Co-Expressed genes & Heatmap, Links) • Function2Expression: • Gene ontology • Sequence • Metabolic pathway • Gene family Knowing exemplar functional annotations Probe Details (alignment, intensity, download, barplots)
Part II. BarleyBase Gene-Centric Data Analysis Flow • Gene ListCreation Methods • Creation by gene expression profiles - Identifying Differentially Expressed (DE) Genes • Statistical Tests. • Fold of change • Absolute expression value • Absolute and relative variability • Creation by biological criteria – Function2Expression • Keyword2Expression - Annotation keywords • BLAST2Expression- Sequence similarity • GO2Expression - Gene Ontology Class • Pathway2Expression - Metabolic pathway or • GeneFamily2Expression - gene family membership. • Importing Gene List
Part II. BarleyBase Gene-Centric Data Analysis • Gene List Creation Steps by Gene Expression Profiles
Step 2. Statistical Test with Multiple Test Correction Is the Principal Method for Identifying Differentially Expressed Genes • Two Group Test • T-Test, Unequal Variance • T-Test, Equal Variance • T-Test Paired, Unequal Variance • Wilcoxon Rank Sum Test (Mann Whitney Test) • LPE Local Pooled Error Test • Multi-Group Test • One-Way ANOVA, Equal Variance • Kruskal-Wallis Rank Sum Test • Multiple Test Correction • Family-wise Error Rate (FWER) Control – Usually Over-Conservative • Bonferroni single-step adjusted p-values • Holm step-down adjusted p-values • Hochberg step-up adjusted p-values • Sidak single-step/ step-down adjusted p-values • False Discovery Rate (FDR) Control – Less Conservative • Benjamini & Hochberg step-up FDR controlling procedure (BH) • Benjamini & Yekutieli step-up FDR controlling procedure (BY) • Data Transformation • Linear scale or Log2 Scale
Step 3A. Cross-Experiment Query by Expression Profile Warning: User is responsible for the validity of Cross-Experiment Query
Step 3B. Composite Filter Options for Expression-Profiles You may construct composite filter from several filters
Step 3C. Importing Gene List of Probe Set or Exemplar Names This approach allows integrating analysis results from 3rd party software Free text can serve as input, without tedious effort in preparing input