Download

1 / 43
430 likes | 459 Views
Learn the key design criteria for creating efficient spreadsheets. Explore conditional formatting, formulas, and "what-if" analysis. Understand symbolic naming importance and planning tools. Follow design guidelines and apply rules in a sample trip spreadsheet scenario.

E N D
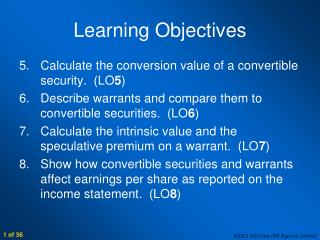
Learning Objectives • State the two basic design criteria for creating effective spreadsheets • Explain how conditional formatting of spreadsheet entries applies an interpretation to spreadsheet information • Explain conditional formulas, and their components and behavior • Perform “what if” analysis with a spreadsheet • Use AutoFiltering and advanced filtering to customize spreadsheet lists • Explain the importance of symbolic naming of spreadsheet cells
Designing a Spreadsheet • When we make a spreadsheet to find an answer and then delete it, all that matters is that the computation was right • When a spreadsheet is used repeatedly, it becomes a tool of planning, analysis, and decision-making • To be effective, a spreadsheet must be well designed, informative, and flexible
Design Guidelines • Two basic principles for setting up effective spreadsheets: • Focus on Form: Make the form logical, the layout clean, and the entries clear and easy to use • ExplainEverything: It should be possible to know immediately what every cell means
Focus on Form • A spreadsheet is used in solving problems • It must be easy to understand and easy to work with • Arrange the data logically: • Descriptive information should be on the top and left sides • Summary information should be on the bottom and right sides
Focus on Form • Fonts should be clear • Colors should be used in moderation • Be an attraction, not a distraction • Use a separate sheet for each table • Individual sheets make working with multiple tables more manageable • Hiding information that isn’t needed is a good way to make a spreadsheet clear and easy to use
Explain Everything • Include meaningful column headings and identifying information about the rows • Cells and ranges are assigned symbolic names so the content becomes meaningful • For summary information cells, choose modifiers like total and largest • For computations, include comments to explain assumptions made when creating the formulas
The Trip Sample Spreadsheet • Scenario: • Two friends wonder if it’s possible to drive to the Arctic Circle from Chicago. • The trip to Inuvik is 3,663 miles from home and will take three days and eight hours of driving time. • The given driving time is continuous, which they do not plan to do. • Use a spreadsheet to figure out how long it will take and how much it will cost.
Applying the Rules • The trip is a five-day trek from Chicago to Dawson, Yukon Territory • From Dawson, they will drive to the Arctic Circle and back to Dawson that night
Applying the Rules • Friends will be included to offset costs • The friends are interested in how much the trip will cost • Part of the trip is through the United States where gas is priced by the gallon in US $ • Part of the trip is through Canada where petrol is priced by the liter in Canadian $
Applying the Rules • The spreadsheet has a title listing the authors and stating the completion date • Columns are assigned clear headings • The heading row is filled with a soft color that separates it from the content • A clean, sans serif font presents the data justified in the cells
Applying the Rules • Comments or “Sticky notes”: • Cells with comments have a red triangle in the cell’s upper right corner • Hovering the cursor over the cell displays the comment • To insert a comment in Excel, select the cell and then navigate Insert > New Comment • To edit it, select the cell and navigate Insert > Edit Comment • To remove a comment, navigate Edit > Clear > Comments
Conditional Formatting • Cell Value Is Specifications • This window lets users specify one or more conditions • If the program finds that these conditions apply to the cell, it formats the entry in the manner specified • Users specify the condition by picking one of a set of relationships and filling in the limits
Conditional Formatting • Formula Is Specifications • It’s possible to format items based on a formula • Using Formula Isallows for acomparison with a cell other than the one being formatted
Distinguish Between Names • The complication: determining when a price is in Canadian dollars • Fuel Price Report column lists the source of the price quote • whenever the country is CA the price should be italicized • =IF(LEFT(D2,2)=“CA”, TRUE, FALSE)
Conditional Formulas • conditional formulas: make the entire computation of a cell contingent on the outcome of a condition
Figuring the Amount Paid • Two choices • express fuel price as a gallon price instead of a liter price • express mileage as miles per liter (mpl) • Either way, the US and Canada cases have to handled slightly differently • =IF(LEFT(D2,2)=“US”, E2*C2/22, E2*C2/5.8)
Figuring the Amount Paid Note: Intermediate computation columns hidden
Cost in One Currency • Essential to know the expenditures in one currency • A Canadian dollar is worth $0.948 in U.S dollars • =IF(LEFT(D2,2)=“CA”, F2*0.948. F2)
Defining Names • It can be helpful when designing a spreadsheet to give names to components of the sheets • A name is a word or phrase assigned to a cell or range of cells • Once the name has been assigned, it can be used wherever cell references would be used
Defining Names • Using names reduces the chance of messing up range specifications • Errors are minimized when columns and rows are added/deleted • Choose Insert > Name > Define . . . and enter a name • The software assigns the name to that range
Defining Names • Now, choose Insert > Name > Apply toallow the use of the name
“What If” Analysis • You want to consider the effects of certain changes • You can do this directly by changing values, then changing them back • Perhaps save the sheet, make changes, and exit without saving • But spreadsheets have better support than that for what-if analysis
“What If” Analysis • Scenarios • A speculative or “what if ” analysis is supported in spreadsheet software by a tool called Scenarios • A scenario is a named alternative to a spreadsheet based on different inputs • A scenario is an aid to understanding changes in plans
“What If” Analysis • The Add Scenario window is the place to name a scenario • The software fills in the cell(s) that will change • Clicking OK takes us to the Scenario Values window • Clicking OK takes us back to the Scenario Manager window where the newly added scenario can be seen in the list
“What If” Analysis • At the bottom of the Scenario Manager window, there is a Summary. . . Button • When clicked, a dialog box appears asking what cell we consider the “bottom line” of the computation • Or, if the scenario came to pass, what value are we most interested in • Click OK again, and you are presented with the Scenario Summary
Reusing Scenarios • Having set up the scenarios earlier, it is possible to rerun them to see how the end result changes • Once run, navigate to the Scenario Manager and click Summary
Scenarios Your textbook discusses the following scenarios. The spreadsheet can compute the changed cost of each choice • Having the car tuned up to improve gas mileage • Taking along extra passengers to share the expenses • Lodging v. camping
Analyzing Data Using Filtering • Use of the Filtering tool allows access to subsets of information held in a spreadsheet • Filtering selects only certain rows from a list • It applies only to spreadsheet tables that have column headings • Filtering lets users create a customized version of a spreadsheet list that is limited to the rows meeting some criterion
Analyzing Data Using Filtering • AutoFilter • Select any cell in the list • Choose Data > Filter > AutoFilter • The result is a redrawn spreadsheet list with triangle menu buttons by each column heading • The menu buttons give you options for filtering the list based on data in that column
Analyzing Data Using Filtering • AutoFilter • Clicking a button opens the menu and presents the options: • include sorting rows • displaying rows containing a limited number of values • displaying only those rows matching a specific value in the column
Advanced Filtering • The filtering dialog for a column allows various criteria to filter the rows • The dialog can also apply multiple criteria combined with AND or OR
Summary • This chapter has taught several advanced spreadsheet techniques: • Two basic principles underlie the design of effective spreadsheets: (1) focus on form and (2) explain everything • Conditional formatting can apply an interpretation to the data in a spreadsheet so that it is easy to perceive
Summary • Conditional formulas using the IF( ) function allow complex, case-specific data definition and analysis • Naming the cells and regions of a spreadsheet allows the parts of a spreadsheet to be referenced in a convenient and less error-prone way
Summary • “What if” analysis is a particularly powerful application of spreadsheets in which the consequences of alternative information can be assessed • Filtering effectively customizes spreadsheet data to particular cases