Download
1 / 32
320 likes | 337 Views
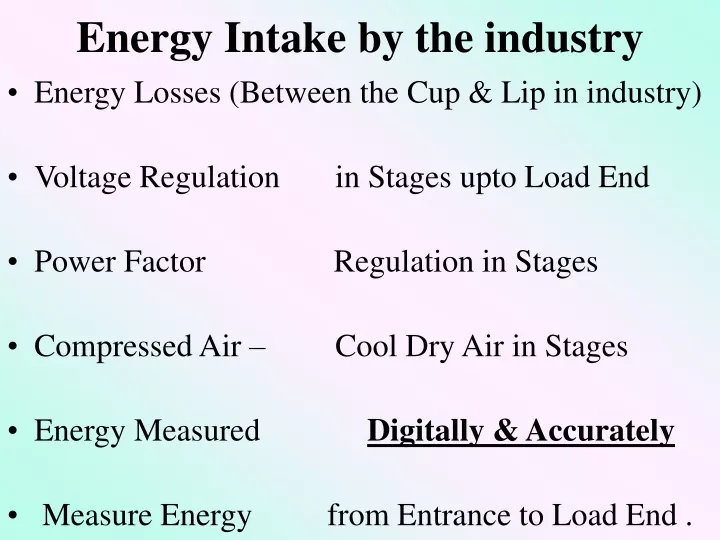
Energy Intake by the industry. Energy Losses (Between the Cup & Lip in industry) Voltage Regulation in Stages upto Load End Power Factor Regulation in Stages Compressed Air – Cool Dry Air in Stages Energy Measured Digitally & Accurately

E N D
Energy Intake by the industry • Energy Losses (Between the Cup & Lip in industry) • Voltage Regulation in Stages upto Load End • Power Factor Regulation in Stages • Compressed Air – Cool Dry Air in Stages • Energy Measured Digitally & Accurately • Measure Energy from Entrance to Load End .
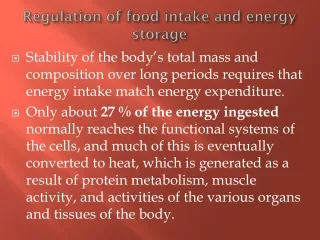
Energy Efficiency Benefits • Reduced Energy bills – Visible Gains ! • Increased Productivity – Invisible Benefits !! • Improved Quality • Increased Profits • Increased Competitiveness • Ultimately, Machines’ Health Improves By :- - Minimum Energy Input & Maximum Output • This Prolongs the life of machines & Safety • Important: We get more from machine even later
Total Energy input Melting Furnaces Annealing Furnaces Compressors Sand plant Other loads lighting 100 % 60 % 17.14 % 11.48 % 2.55 % 6.52 % 2.28 % Energy usage Break-up in FoundryApproximate power consumption of Major Equipments ( Typical )
ELECTRICAL DISTRIBUTION SYSTEM -- SINGLE LINE DIAGRAM EB POWER M DG SET TRIVEATOR METER Metering 11 KV/440V Transformer Effi.95-98% M Dist. loss 4 - 8% Feeders, Capacitors M M M M C MECHANICAL ELECTRICAL Distribution Panels C C Motors Effi.85-96% FANS & BLOWERS PUMPS R & AC COMPRESSORS LIGHTING, HEATING
Foundry furnace savings aspects • Busbar losses - joints inpsect, overheating, discolor • Pneumatic ckt - demoist, lubricate, press regulate • Hydraulic ckt - oil level, filter, proper functioning • Refractory lining - to check before & after melt’ • Transformer - ventilation, forced, oil temp, connect’ • Water ckt - quality, temperature, pressure ratings • Water temp < 42 * C to prevent scale formation • CT - functioning and water In /Outlet temperature monitoring etc., wooden fill > pvc fills practically.
Radiation losses in foundry • Temperature - Energy loss - Energy loss *C - btu/sqft/hr - kW /m2 • 555 8000 25.28 833 20,000 64.56 1115 52,000 161.4 1400 1,25,000 387.4 • Radiation – Line of sight phenomenon : Heat loss proportional to difference of 4th power of hot & cold • Practice to allow 100 –150 *C higher temp for melt to take care of heat loss in sadle & during transit • Each 1* extra temp > 1 to 2 kwh extra consume/ton • Temperature monitor by pyro & T/Couple
Thermal Efficiency parameters of Induction Furnace • 3 to 10 % Losses in the Electrical System in connecting the bus bars • 18 to 22 % losses in Induction coil as well as the water cooled leads • 4 to 6 % losses in keeping the lining hot • 2 to 4 % losses in radiation etc. • 55 to 75 % Thus the Thermal Efficiency of Induction Furnace varies in the range.
Flames leaping out of furnace • Two identical furnaces taken for case study • Gun metal to be melted was weighed & charged. • One furnace was operated normally by the operators by leaping out the flames outside. • Other furnace was operated by confining the flame within the furnace • Time taken to melt the charge is the same for both the furnaces; but the fuel consumption was only half.
The table below Compares the behavior of 5 H.P motor at Higher than 400 voltscourtesy – Muskan Servo OEM study
Improved Power Factor Correction on typical 50HP Motor gives significant results.
Thermal Imaging – Tool to Predictive Maintenance – Management
Effect of Voltage Unbalanceon the performance of 5 HP motor :- is more detrimental to motor performance and motor life than voltage variation.Increased temp. rise is 40 *C for unbalance of 5 %Say motor temp is 60 * , then this raises to 100 * C.
CONDITION MONITORING Infra red gun readings point to : - 0 to 10* C high : - Corrective measure to take during next maintenance period. 10 to 20* C high : - Corrective measure required as scheduled Maintenance permits. 20 to 40* C high : - Corrective measure required As Soon As Possible. 40*C and high : - Corrective measure required immediately.
CA system Air intake –Rupee wise, Paisa Foolish • Compr. Air intake Temp. 3*C raise, Power Up 1 % • 100 scfm @ 7 bar Annual Comp Air use Rs. 6 Lacs • Daily clean Pre Air Filter before Air intake Filter • 160 Scfm Compr. @ 7 bar at 45*C air outlet pumps 1 Litre more water in air per hour than at 35 * C
Compressed Air systems – Are we Healthy ? • Don’t crack drains manually all over.Auto-drain valve with balancing pipes to be effective • Regulate at start & Demarcate HP & LP air usage & shut off the airlines when not in use • Provide large air receiver near heavy consumer to avoid shock load, fluctuations in system pressure • Filter Lubricator Regulator at end usage point to be inspected daily and oil maintained regularly. • PLMS pipe line moisture separator to be active at start and end of line, & at usage point.
CA usage Efficiency Example • An open 6 mm pipe could consume about 70 CFM of air at 5.5 bar pressure which means about entire compressed air generation of 20 HP air compressor. In contrast • Energy Efficient Nozzles and jets • consumes only 20 CFM air at 5.5 bar pressure yet provides adequate thrust and air volume for most applications.
Why we use air blow guns instead of blunt nylon hose ? • The flow through a leak is similar to an orifice in that the flow is determined by the pressure immediately upstream of the opening. • The pressure drops in the line supplying air to the leak based on line's ability to support rate of flow. • For example, the air flow across a 1/4" orifice at 90 psig is 94 scfm • but the flow through ten feet of 1/4" I.D. copper tube at 90 psig will be less than 40 scfm because the pressure will drop to 35 psig in the tube.
CA system efficiency improves by : • Reduction of 1 Kg/cm2 air pressure (8 Kg/cm2 to 7 Kg/cm2) results in 7% input power savings • Using solenoid ball valves wherever required • Installation of after coolers and dryers • Carrying out pump – up test, leakage test, specific power consumption determination regularly • Ensuring proper air /water cooling of compressor • 1mm scale build-up on condenser tubes increases energy consumption by 40%
Compressed Air loss - Examples Leakage @ ½”dia hole in Compressed Air line @ 7 Kgsc can drain almost Rs.2500/- per day Hour meter on Compressor Load/ Unload Status Compressor works like Submersible pump in air. Cool Compressor delivers more air. Continuously run Compressor delivers less than an intermittently run Compressor.
“ we must know what we consume where ” Preliminary energy audit is a relatively quick exercise • to Establish energy consumption in the organization • Estimate the scope for saving • Identify the most likely ( & easiest areas for attention.) • Identify early ( no-/ low-cost) improvement & savings • Set a reference point / Bench mark within the machine • Identify areas for more detailed study/measurement • Preliminary audit uses existing, and easily obtained data.
Energy Audit shows where we stand • What to do, • where to start, • at what cost and • for what benefits • First step is start with Preliminary Audit with existing Datas. • Second step is Detailed Audit & Generate more Parameters. • Indicative saving potential to achieve • Good House-keeping yields 5 - 10% • Minor Investment gives 10 - 15% • Reasonable Investment pays back 20 - 25%
Shock, Relief & Delight • The three stages of accepting results of an energy study or audit of process & utility are • Shock, Relief and, finally, Delight ! • The general wrong opinions about Maintenance has been • "Maintenance is a necessary evil" • "Nothing can be done to improve maintenance costs” • Please remove the opinions & now Remember: • Where Safety (Conservation) Fails, Pollution Starts. • Maintenance is a Tool to Productivity • Utility to process is like Medicine in bottle to our body. • Shake bottle before use & shake our body after intake for quick & better results of medicine.
FIVE COST REDUCTION MEASURES OF ENERGY CONSERVATION • Identify inefficient energy use • Upgrade machinery & process in context of energy efficiency • Improve maintenance practice • Promote employee awareness and • Conservation in domestic consumption.
Tube light– variation in Light output & Power output • Particulars 10% low-360 volt 10% high – 450 volts • Light output Decreases by 9 % Increases by 8 % • Power input Decreases by 15 % Increases by 8 % • Take the case of your transformer without OLTC • Low & High voltages are 400 to 450 volts in day & night • Lighting wants safe regulated working 360 volts only • Priority is towards Energy Savings in Lighting • More priority is in Safety in lighting voltages • Tube light life increases and inventory comes down • Not only for tube lights but also for ballasts also.
Conserve Energy & Serve Nation • www.pcra.org • www.energymanagertraining.com • Please go through the Govt. Website • and you will find mine & more articles on Industry • Thank YouS.ASHOK, PCRA Faculty BEE certified Energy Auditor COIMBATORE – 05. cell : - 9 4 4 3 7 - 2 0 2 2 0 ID :- ashok.anbesivam@gmail.com Pl visit my site WWW.energymeasuretosave.com