Download
1 / 41
420 likes | 778 Views
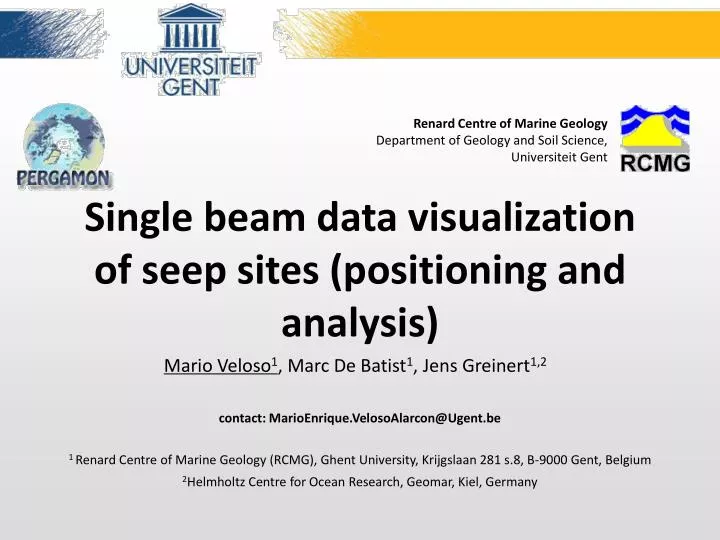
Renard Centre of Marine Geology Department of Geology and Soil Science, Universiteit Gent. Single beam data visualization of seep sites (positioning and analysis). Mario Veloso 1 , Marc De Batist 1 , Jens Greinert 1,2. contact: MarioEnrique.VelosoAlarcon@Ugent.be

E N D
Renard Centre of Marine GeologyDepartment of Geology and Soil Science, Universiteit Gent Single beam data visualization of seep sites (positioning and analysis) Mario Veloso1, Marc De Batist1, Jens Greinert1,2 contact: MarioEnrique.VelosoAlarcon@Ugent.be 1 Renard Centre of Marine Geology (RCMG), Ghent University, Krijgslaan 281 s.8, B-9000 Gent, Belgium 2Helmholtz Centre for Ocean Research, Geomar, Kiel, Germany
Hydroacoustics Techniques • Non-invasive method used to study the water column using the backscattering produced due the change of impedance when the sound wave travel through different media
Echosounder • Active system used to detect scatterers in the water column due the impedance change. • Types • single beam • dual beam (location of targets inside the beam) • split beam (location of targets inside the beam)
EK60 (split beam technique) From Medwin and Clay (1998), Fundamentals in Acoustic Oceanography
EK60 (split beam) Measurements of the TS and SV able to locate targets inside the beam More precision
Data acquisition (recomendations) • cross track recording to compare: strength of the source, real position, height of the acoustic flares. • speed of the vessel (SMS if is possible) • more resolution identification of targets due their shape
Softwares and reason to create a GUI • non-specialized softwares for free gas releasing analysis • detection, analysis, and precision of spatial distribution of the seep sites. • Flexibility to manipulate de data acquired
(Graphical User interface) FlareHunter
FlareHunter (GUI) • Capabilities of the current version: • Bottom detection • Echogram of the Sv and TS • Motion compensation • 3D view of the backscattering using the information of the split-beam technique • Geometrical average of the backscattering selected to have a more precise • information of the gas releasing source.
Data correction (usually not included in software for echograms analysis) Motion compensation (pitch, roll, yaw and heave)
Data correction (usually not included in software for echograms analysis) Static offset correction Transducer GPS
Data correction (usually not included in software for echograms analysis) Ray tracing correction (sound refraction),in case the signal is reaching deep waters
Processing • Free gas release detection(acoustic flares) • 3D visualization • geometrical average of the backscattering from the seep sites • accurate coordinates of the source of every seep site
Acoustic flare fish Free gas release detection (hydroacoustics) • What are we measuring in single beam echosounder data • and what are we seeing in in the echograms? • Basically, the physical properties • of the methane releasing from the seabed. • Seep location (coordinates) and tendencies. • Bubble rise height • Signal strength (Sv and TS) = flux strength Image of acoustics flares visualized in echoview, Simrad EK60 echosounder (survey RV Helmer Hansen 2012) 18
Flare detection (hydroacoustics) 3D view of the spatial distribution of the free gas releasing in the study area Once the data have been corrected and the seeps sites detected in the echogram, location of seeps sites can be known ...but still accurate positioning of bubble vents at the seafloor is often difficult Image of the seep sites distribution, Integration of multibeam and single beam data using Fledermaus and FMMidwater tools 19
3D Visualization and geometrical average FlareHunter (GUI) Steps • Selection of the scatterers of the acoustic flare under certain threshold • 3D visualization and cleaning of evident noise (fish) • Geometrical average of the backscattering selected to have a more precise • information of the gas releasing source. 3D view of the spatial distribution of the free gas releasing in the study area Screenshot of the FlareHunter tool developed to analyze the captured data with the split-beam echosounder EK60 20
3D visualization • location of the gas releasing source. • Flarehunter screenshot with the selection of the flare (apparently 2 flares). • 3-D image (Fledermaus) showing the spatial backscattering of the seep and the geometrical average (Geomean tool) of this backscattering. Backscattering coming from the same source. a) 3D view of the spatial distribution of the free gas releasing in the study area b) end Heading of the ship during the selected shown time (echogram). 21
3D visualization and Geomean processing • Image of the hydroacoustics single-beam data processed with Flare Hunter and visualized in Fledermaus. • The 3-D image shows an example of the backscattering coming from single targets (fish), a seep and the geometric mean of the backscattering of the bubbles, the “flare-spine”. flare fish geometric mean “flare spine” 22
Flare spines of different years(2009, 2010, 2012) offshore NW-Svalbard, west of Prins Karls Forland).
Positions of hydroacoustics survey corrected with the geomean tool Hydroacoustics survey Svalbard 2009, 2010 and 2012.
Acoustic maps (Sv) 2009 dB 2010 2012
Interpretation (analysis of the seeps in echograms) 27
Questions Is the free gas reaching the surface? (height of bubble path in the water column) How fast are the bubbles rising? (flux) How strong is the source? (flux) 28
To know the height of the bubble path in the water column IMPORTANT limitations of the echosounder system Sometimes the path of the bubbles in the water column is partially insonified consequence: Echograms can give "partial information" 29
analysis of the seeps in echograms • Bubble rise height, are they reaching the surface? bubble path partially insonified smaller footprint at closer distances of the transducer 30
analysis of the seeps in echograms • Bubble rise height, are they reaching the surface? bubble path partially insonified motion of the vessel 31
analysis of the seeps in echograms • Bubble rise height, are they reaching the surface? bubble path partially insonified tilted release 32
analysis of the seeps in echograms • Consequence: • Not possible to assume the height of the flare is the final rise height of the bubble • Possible solution: • several samples of the same seep site to compare height values
analysis of the seeps in echograms Data need to be spatially re-assessed to compare height values of the same seep sites (also strength) 34
bubble rising speed measurements To measure bubble rising speed Data recorded at slow speed of the vessel Slow Mode Sampling SMS (Ostrovsky et al. 2009) dZ 20.4 m dT 130.93 s 36
Histogram of the rising speed values from the hydroacoustics data collected in June 2012 on board RV Helmer Hanssen The Figure shows the frequency of the different bubble rising speed measurements (n=25). The most frequent value is around 24 cm/s. 37
Estimations of bubble sizes can be obtained using therelationships between bubble rising speed versus bubble size McGinnis et al. (2006)
Information extracted from the hydroacoustic data • Accurate positioning of seep sites (monitoring and temporal/spatial variability) • average values of TS, Sv and acoustic cross section area of the multiple targets coming from the free gas sources( temporal/spatial variability and flux measurements) • Height of acoustic flares (final depth of bubbles) • Rising bubble speed values in case of single bubble visualization (flux measurements). • bubble sizes using the relationships with bubble rising speed. 39
Conclusions • Tool to analyze our hydroacoustic data(Flarehunter) from the EK60 split echosouder. • Flexibility to create more applications to analyze the hydroacoustics data coming from the split beam echosounder. • Accuracy in the location of seep sites useful for temporal and spatial variability of seep sites • Work in progress • Measurements of methane fluxes from different years (hydroacoustic method) integrating hydroacoustic information with videocamera observations (BSD) 40