Download
1 / 32
320 likes | 342 Views
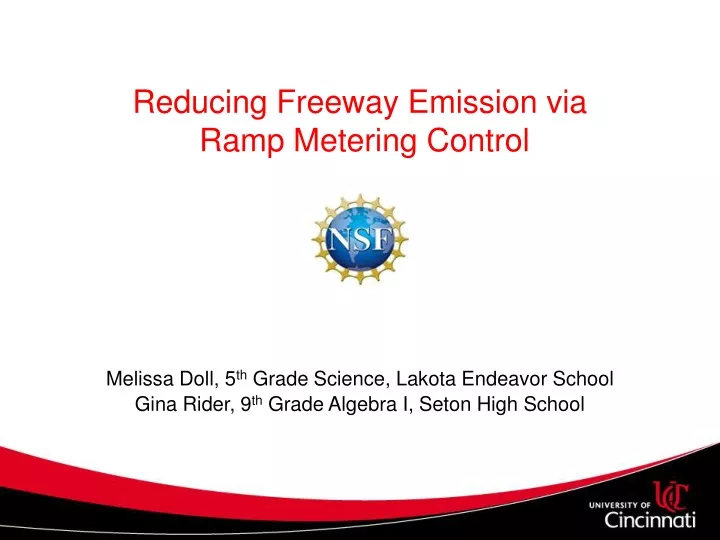
Reducing Freeway Emission via Ramp Metering Control. Melissa Doll, 5 th Grade Science, Lakota Endeavor School Gina Rider, 9 th Grade Algebra I, Seton High School. Abstract Introduction Congestion Control Ramp Meter System Project Overview Background Literature Review

E N D
Reducing Freeway Emission via Ramp Metering Control Melissa Doll, 5th Grade Science, Lakota Endeavor School Gina Rider, 9th Grade Algebra I, Seton High School
Abstract • Introduction • Congestion Control • Ramp Meter System • Project Overview • Background Literature Review • Goals and Objectives • Research Tasks • Evaluating Output • Project Conclusion • Timeline • References • Challenge Based Learning Units • Acknowledgements Table of Contents
Evaluating the efficiency of ramp metering with respect to emissions • Study conducted using the following: • Traffic counts • PM 2.5 sensors • GPS data • Criteria developed for future study sites Abstract
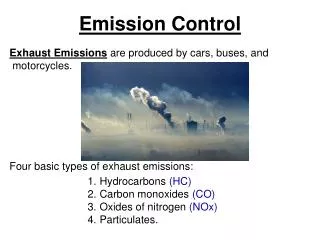
More than 50% of congestion is recurring mainly due to heavy volume. 5.5 billion extra hours spent travelling. 2.9 billion extra gallons of fuel used. Total congestion cost of $121 billion spent. Introduction
Congestion occurs on freeway ramps and mainline because of platoons of vehicles attempting to merge onto the freeway Ramp meters are traffic signals on freeway entrance ramps Congestion Control
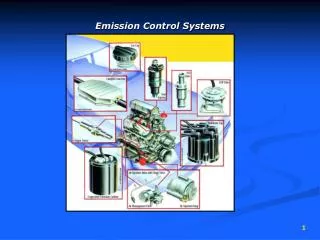
Fixed-timed systems and sensor monitored systems • Allows cars to join freeway mainline without disrupting traffic flow Ramp Meter System Source: RET 2014 presentation slide
Ramp meters are an effective tool for mitigating freeway traffic congestion. This study focuses on the use of ramp meters to mitigate vehicle emissions. Project Overview Source: www.whio.com/photo/news/local/obama-visit-crumbling-brent-spence-bridge Source: http://ethanolfacts.com/lower-toxic-emissions/
Madison Beltline study concluded that ramp meters did improve traffic flow; citing a 3% to 18% increase depending on direction and time of day. Literature Review Kim, G., Lee, S., and Choi, K. (2004). “Simulation-Based Evaluation for Urban Expressway Ramp Metering: a Madison Beltline Case,” KSCE Journal of Civil Engineering, Springer, Vol. 8, No. 3, pp. 335-342.
In a southern California study, freeway emissions (CO2) were reduced by 7% when traffic maintained a steady flow (60 mph). Literature Review Barth, M. and Bonboonsomsin, K. (2008). “Real-World Carbon Dioxide Impacts of Traffic Congestion,” Transportation Research Record: Journal of the Transportation Research Board, Vol. 2058, pg. 163.
Goal: Evaluating the effectiveness of a ramp meter at reducing freeway emissions • Objectives: • Understanding Traffic Flow, Queueing, Shockwave Theories and Ramp Meter Operations • Collecting GPS and PM 2.5 data • Using MOVES to analyze data and to compile results Goals and Objectives
Research Training in the following areas: • Traffic Flow Theory • Queuing Theory • Shockwave Theory • Ramp Metering Systems Research Tasks
Research Training Counting Traffic on Martin Luther King PM 2.5 Sensor I-74 Study Site
Melissa: counted cars and trucks on freeway mainline Sri: counted cars and trucks on entrance ramp Gina: drove freeway loop to collect GPS data Dr. Corey: charted and organized data Research At Study Site
Evaluating Output Sensor Data for Sensor #1 Horizontal Axis is measuring time in seconds Vertical Axis is measuring voltage spike Sensor was taking a voltage reading every second.
Evaluating Output Sensor Data for Sensor #2 Horizontal Axis is measuring time in seconds Vertical Axis is measuring voltage spikes Sensor was taking a reading every second.
MOVES was not utilized since there was no evidence of freeway congestion • Criteria generated for future study sites • Access Conditions • Traffic Conditions Project Conclusion
Possible Sites for Future Studies Colerain Avenue--Eastbound Mitchell Avenue--Northbound Montana Avenue--Eastbound
Project Timeline Traffic, Shockwave, Queueing Theories MOVES, GPS Sensors MLK, I-75, Dalton Ave, I-74 Literature Review, Powerpoint, Video Workshops Development of individual units and activities
Big Idea: • Efficient Traffic Flow Essential Questions: • What is acceptable wait time? • How can we minimize the number of people waiting in a “service” line? • How can intersections be improved to move cars at a more constant rate? Gina’s Unit Topic9th Grade Honors Algebra IWait Time
Lesson 1 Activity 2Queue Theory • Activity: • Waiting in line at the gates of Kings Island
Students will be creating a graphical model of an “ideal” intersection • Constraints: • Lanes required for all turns • Bus and bicycle lanes required • Pedestrian crosswalks required • Must be aesthetically pleasing ChallengeMakeover An Intersection
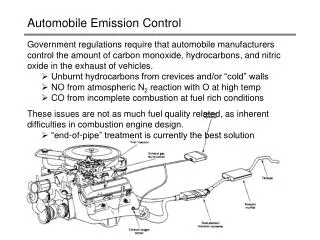
Unit Topic: Force, Motion and Speed • Big Idea: Cars are moved by a force and the amount of force can be calculated (speed). • Essential Question: How can different forces be used to move a car forward? • Standard:5 PS 4 The amount of change in movement of an object is based on the mass of the object and the amount of force related. Melissa Doll’s Unit5th Grade ScienceForce, Motion and Speed
Hook- show video of NASCAR crashes • Lesson on forces Lesson 1 Activity 1
Force Lab- • Station one-magnetic marble and magnetic wand • Station two- toy car that operates by pushing down on a spring • Station three- balloon that is blown up • Station four- toy car • Station five- blow drier and ping pong ball • Station six- pinwheel • Station seven- marble track toy • Station eight-cork in a cup of water Lesson 1 Activity 2
Lesson on Speed • Marble ramp lab-students roll 3 different mass ball bearings down a ramp at different inclines to increase speed. Student will change mass first and measure the movement of a block at end of ramp. Then students will change incline, speed and measure movement of a block. Lesson 2 Activity 3
Students will work in groups of three • Task: Create a vehicle that can travel a distance of at least 5m using one of the forces from the unit. • Constraints are as follows: 1. The vehicle cannot be pushed or pulled to begin movement. 2. It must be an original design. No store purchased toys or kits may be used 3. It must travel a distance of at least 5m for three consecutive trials. 4. No vinegar and water, mementos and coke, gas- propane or derby cars. 5. Must use items found in your house. Lesson 2 Activity 4
The RET Program is funded by the National Science Foundation, Grant ID # EEC-1404766 • Special thanks to the following, who without their support, this project would not have been possible: • Project Faculty Member, Dr. Jonathan Corey • Graduate Research Assistant, Mr. Sri Harsha Mulpuru • RET Project Director & Private Investigator, Dr. Anant R. Kukreti • RET Resource & Grant Coordinator, Debbie Liberi • RET Resource Teacher, David Macmorine Acknowledgements