Download
1 / 9
90 likes | 122 Views
Discussion Class 8. Measuring Usability. Discussion Classes. Format: Question Ask a member of the class to answer. Provide opportunity for others to comment. When answering: Stand up. Give your name. Make sure that the TA hears it. Speak clearly so that all the class can hear.

E N D
Discussion Class 8 Measuring Usability
Discussion Classes Format: Question Ask a member of the class to answer. Provide opportunity for others to comment. When answering: Stand up. Give your name. Make sure that the TA hears it. Speak clearly so that all the class can hear. Suggestions: Do not be shy at presenting partial answers. Differing viewpoints are welcome.
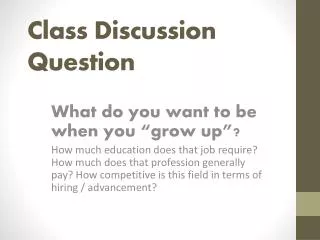
Question 1: Aspects of Usability Explain what the authors mean by: (a) Effectiveness (b) Efficiency Satisfaction In this course, what measures have we seen of each of these aspects?
Question 2: The TeSS Experiment What was the objective of the TeSS Experiment? In analyzing this experiment, how did the authors measure: (a) effectiveness (b) efficiency satisfaction What impact does the method of measurement have on the results of the experiment?
Question 3: TeSS Experimental Design Who were the subjects? How were they chosen? What tasks were they given? What were the retrieval modes? The tasks, retrieval modes, and ability of the subjects all differ considerably. How does the experiment allow for these variations? How did the experiment control for the effect of the subjects learning about the materials as they carried out the tasks? The experiment was designed to gather 1,740 items of data, but some data was missing. Why? Does it matter?
Question 4: Interpretation of Data Mode Mean Median time grade Browse 22.88 3 Logical 30.15 3 Venn 25.79 3 All 30.80 3 Paper 15.66 4 What hypotheses does this table suggest about the relationship between effectiveness and efficiency?
Question 5 Discuss the observation: The figure shows Spearman's correlation coefficient for each of 20 information retrieval tasks. Time and grade are significantly correlated for tasks 11, 13, and 17.
Statistical Hypothesis Testing Correct Formulate an hypothesis (perhaps by a preliminary experiment) Design tests Carry out experiment Apply tests Publish results Wrong Gather data Apply lots of tests Publish the results of tests that appear significant
Question 6: Correlations between aspects of usability Figure: The usability aspects measured in the 19 studies of complex tasks from CHI '97 to CHI '99. Only one study analyzed the correlations between the aspects. What conclusion did it reach? What are the general conclusions of this paper?