Download
1 / 36
370 likes | 571 Views
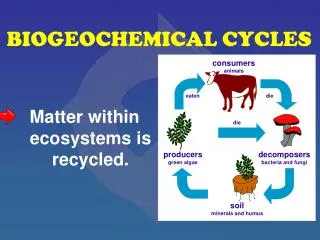
Eutrophication 2 .1 Biogeochemical cycles. Alice Newton P. Viaroli. Important nutrients N:P:Si. Ratios N:P and N: Si are especially important N is usually limiting nutrient in coastal waters and estuaries. Can be fixed by cyanobacteria

E N D
Eutrophication 2.1Biogeochemical cycles Alice Newton P. Viaroli
Important nutrients N:P:Si • RatiosN:P and N: Si are especially important • N is usually limiting nutrient in coastal waters and estuaries. Can be fixed by cyanobacteria • P most important in freshwaterlakes.Anoxic sediments release P • Si important for phytoplankton composition (diatoms)
Redfield ratio N:P 16:1 • N limited when <16:1 • P limited when >16:1 • Range of 10 to 25 is “normal” • N:P in sewage, manure and fertilizers is different from Redfield ratio.
N:Si 1:1 • Upstream eutrophication in rivers traps Si in sediments before it reaches estuaries • Dams: trap Si • Si availability controls diatom growth • Decrease in Si relative to N & P linked to changes in phytoplankton community and HABs
-3 -1 0 +1 +2 +3 +5 Assimilative reduction Dissimilative Nitrate Reduction to Ammonium denitrification N-fix AR A nitrification AnAmOx (red-ox) N-cycle Biochemical pathways P. Viaroli
Nitrogen fixation N2+6e-+ 6H+ 2NH3 Nitrification1: NH4++ 0.5 O2 NH2OH+ H+ NH2OH + O2 NO2 -+ H2O + H+ Nitrification (+O2) Nitrification2: NO2 - + 0.5 O2 NO3 - Denitrification (+OM, -O2) Ammonium-ammonia equilibrium NH3 + H3O+ NH4++ H2O pKa = 4.75 Nitrification total: NH4++ 2O2 NO3-+ H2O+ 2H+ P. Viaroli
Nitrogen cycling in pelagic waters (plankton-dominated) N2 NO3- NO2 - N - phytoplankton N in zooplankton N-fish N-detrital NH4 + N in benthos (zoo and phyto) N - sedimentary P. Viaroli
Biology of N • Gaseous N2 not useful to most photosynthesizers • N fixation • eg Trichodesmium can produce NH4 from N2 • Microbes and BG algae may form NO2 and NO3 • NH4, NO2 and NO3 can be used as nutrients by photosynthesizers • Proteins in Organic matter are excreted or decompose as NH4
N Atmosphere NO - NO - NH + 3 2 4 N 2 N O 2 NO 2 N-cycle in shallow waters water Nitrogen fixation Cyanobacteria Nitrification oxic horizon Nitrosomonas, Nitrobacter . N org DNRA Ammonification Anoxic horizon Denitrification Pseudomonas,Thiobacillus P. Viaroli
light light dark dark Denitrification from water nitrate Coupled nitrification-denitrification Denitrification (mmol m-2 h-1) in a Ruppia meadow
light dark Denitrification rates determined with dark and light incubations
Quantifying the N cycle • N cycle: • Natural Sources of N • Anthropogenic sources Natural Sources • Lighteningfixation 5-10Tg pa • Natural N fixation (non crop)90-140 Tg p.a. • Marine fixation 30-300 Tg pa??? (Teragrams = 1 million metric tonnes)
Anthropogenic sources of N • Industrial fixation inc Fertilizer 80Tg of N pa (NH3 & N2O) 2020 projection 134 Tg pa • Agricultural LegumeFixation32-53 Tg pa • Fossil fuels 20 Tg pa (NO & NH3) 2020 projection 46Tg pa • Forests Burning 40 Tg pa (NO, N2O & NH3 ) • Loss of wetlands (denitrifying) 10 Tg pa • Land clearing for crops 20 Tg pa • Domestic and Animal Waste32 Tg pa (NH3) 1996 Total annual anthropogenic N inputs ~140Tg (Teragrams = 1 million metric tonnes) see text below
Human alteration to N cycle • N has doubled in 50 years (C has only increased 10%) • 80 Tg of N pa applied as fertilizer • 174 kg/ha/pa Xs • Impacts include: • Increase N2O, (nitrous oxide, a greenhouse gas), due to burning of fossil fuels • Increased NO (nitric oxide, photochemical smog formation) • Acidification of soils and freshwater • Erosion & leaching of N to estuaries and coast (Teragrams = 1 million metric tonnes)
Changes in N cycle Revised Kates et al. (1990).
NOx and NHx in the Atmosphere Origins • Domesticcombustion • Industrial processes • Traffic • Agricultural sources • Animal housing • Spreading of manure
Atmospheric Deposition of N in the North Atlantic Ocean • AD-Nto the NAObasin arises from pollution sources in North America and Western Europe • Sources have increased drastically (5-10-fold) since the Industrial Revolution and continue to increase in both geographic and depositional magnitude. • AD-N flux (11.2 Tg N yr-1 ) accounts for 46-57% of the total "new" or anthropogenic nitrogen flux to the NAO. (Teragrams = 1 million metric tonnes)
Transfers of nitrogen • N fixed in industrial areas • N transported to agricultural areas • N applied to fields, some retained in crops • N loss to atmosphere and water • Crops transported to livestock producing areas and cities • Crops consumed in cities and N enters sewage • Animal feed crops consumed in livestock farms • Livestock transported to cities • Manure spread on fields, enters atmosphere and water
Atmosphere Industrial areas Agricultural areas Livestock area Cities Aquatic environment
Natural transfers • Sea Birds and guano • Salmon migration and death
N input into Aquatic Systems Modifiedfrom Howarth et al. (1996)
Nitrate concentrations have been largely unchanged since 1980 NO3 in major EU rivers 1980-95 EEA
P-Cycle P most important in freshwaterlakes P limitation has been documented in coastal waters and estuaries: Apalachicola (Gulf of Florida) some Dutch estuaries Tropical systems with carbonate sands P is released from anoxic sediments N-fixing cyanobacteria proliferate when P is abundant, e.g. in the Baltic sea
P-Cycle P.Viaroli
P-cycle External load Organic Detritus Assimilation Primary producers Decomposition Assimilation PO4 P-Refractory Clay De-sorption Ad-sorption Fe P Ca P Precipitation (es:apatite, hydroxiapatite) burial/early diagenesis P. Viaroli
Human alteration to P cycle • 600 Tg applied as fertilizer from 1950 to 1995 • ~250 Tg of P harvested as crops • ~50 Tg used as feed crops returned to soil as manure • Net XS addition 400 Tg in 45 years, ~10 Tg p.a. (Teragrams = 1 million metric tonnes)
Phosphorus concentrations in some EU rivers have fallen since the mid-1980s, particularly in the largest and most polluted rivers. EEA. P in major EU rivers 1980-95
NO3 & PO4 in EU coastal waters, 1985-1996 Nutrient concentrations in coastal waters show little overall improvement