Download
1 / 42
420 likes | 427 Views
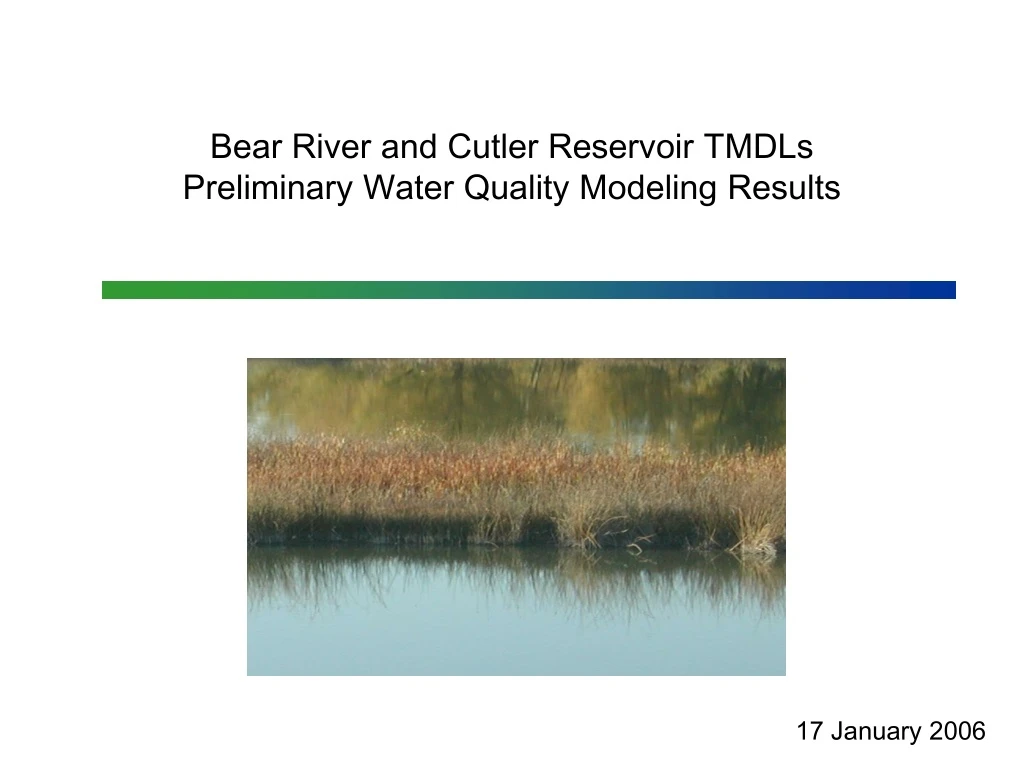
Bear River and Cutler Reservoir TMDLs Preliminary Water Quality Modeling Results. 17 January 2006. Bear River and Cutler Reservoir TMDLs – January 2006. Water Quality Modeling BATHTUB (USACOE) Data Needs Flow Concentration Physical characteristics.

E N D
Bear River and Cutler Reservoir TMDLs Preliminary Water Quality Modeling Results 17 January 2006
Bear River and Cutler Reservoir TMDLs – January 2006 • Water Quality Modeling • BATHTUB (USACOE) • Data Needs • Flow • Concentration • Physical characteristics
Bear River and Cutler Reservoir TMDLs – January 2006 • Data Sources • Utah Division of Water Quality • EPA STORET data • PacifiCorp • USGS • Local studies • TMDLs • Western Regional Climate Center • Utah Division of Water Resources • Utah Division of Natural Resources
Bear River and Cutler Reservoir TMDLs – January 2006 • Hydrological Coverage
Bear River and Cutler Reservoir TMDLs – January 2006 • Hydrological Coverage
Bear River and Cutler Reservoir TMDLs – January 2006 • Hydrological Coverage
Bear River and Cutler Reservoir TMDLs – January 2006 • Seasonal Flow (Average year) • Bear River • Winter 24% • Spring 32% • Summer 22% • Fall 22% • Tributaries • Winter 12% • Spring 55% • Summer 21% • Fall 12%
Bear River Line Flow Diagram For Bear River Major Inflows to the Bear River – Cutler Reservoir Reach (Map is not drawn to scale) Cub River Summit Creek Newton Creek Clay Slough Hopkins Slough Swift Slough RR – foot bridge Logan River RR Bridge Spring Creek Cutler Dam Little Bear River Benson Road Hwy 23 Hwy 30
Bear River Line Flow Diagram For Bear River Major Inflows to the Bear River – Cutler Reservoir Reach (Map is not drawn to scale) Cub River Summit Creek Newton Creek Clay Slough Hopkins Slough Swift Slough RR – foot bridge Logan River RR Bridge Spring Creek Cutler Dam Little Bear River Benson Road Hwy 23 Hwy 30
Bear River and Cutler Reservoir TMDLs – January 2006 • Water Quality Data • 15 locations upstream Bear River • 4 in-lake Cutler Reservoir locations • 1 Bear River location downstream of Cutler Dam • 18 inflow and instream tributary locations • 6 point source discharge locations • 3 irrigation/stormwater drains • ground water data from USGS and other sources • 1 local well site
BR and CR TMDLs – Jan 06 • Critical Monitoring Sites
Line Flow Diagram For Bear River Major Inflows to the Bear River – Cutler Reservoir Reach (Map is not drawn to scale) ID/UT state line Bear River WQ Sample Site Cub River Summit Creek Newton Creek Clay Slough Hopkins Slough Swift Slough RR – foot bridge Logan River RR Bridge Spring Creek Cutler Dam Little Bear River Benson Road Hwy 23 Hwy 30
Line Flow Diagram For Bear River Proposed Model Segments (Map is not drawn to scale) ID/UT state line 9 Bear River Cub River Cutler Reservoir Model Segment 8 Bear River Model Segment Summit Creek Newton Creek Clay Slough Hopkins Slough Swift Slough 7 RR – foot bridge Logan River RR Bridge Spring Creek Cutler Dam 6 Little Bear River 1 2 3 4 5 Benson Road Hwy 23 Hwy 30
Line Flow Diagram For Bear River Proposed Model Segments (Map is not drawn to scale) ID/UT state line 9 Bear River WQ Sample Site Cub River Cutler Reservoir Model Segment 8 Bear River Model Segment Summit Creek Newton Creek Clay Slough Hopkins Slough Swift Slough 7 RR – foot bridge Logan River RR Bridge Spring Creek Cutler Dam 6 Little Bear River 1 2 3 4 5 Benson Road Hwy 23 Hwy 30
Line Flow Diagram For Bear River Proposed Model Segments (Map is not drawn to scale) ID/UT state line 9 Bear River WQ Sample Site Cub River Cutler Reservoir Model Segment 8 Bear River Model Segment Summit Creek Newton Creek Clay Slough Hopkins Slough Swift Slough 7 RR – foot bridge Logan River RR Bridge Spring Creek Cutler Dam 6 Little Bear River 1 2 3 4 5 Benson Road Hwy 23 Hwy 30
Bear River and Cutler Reservoir TMDLs – January 2006 • Concentrations • Good match with existing data • Refining the ground water balance • Still refining the Segment 3 • Benson Marina to Clay Slough
Measured and projected dissolved phosphorus concentrations (mg/L) for model segments in the Bear River (vertical plot) and Cutler Reservoir (horizontal plot) PRELIMINARY RESULTS - NOT NECESSARILY REPRESENTATIVE OF FINAL VALUES Concentrations represent modeled boundary conditions and calculated outputs based on measured and extrapolated water column concentrations specific to seasonal monitoring (1995 to 2004)
Bear River and Cutler Reservoir TMDLs – January 2006 • Concentrations • Dissolved Phosphorus • Slight increase within Bear River • Highest concentrations from the South tributaries • Substantial decrease South to North in-reservoir
Measured and projected total phosphorus concentrations (mg/L) for model segments in the Bear River (vertical plot) and Cutler Reservoir (horizontal plot) PRELIMINARY RESULTS - NOT NECESSARILY REPRESENTATIVE OF FINAL VALUES Concentrations represent modeled boundary conditions and calculated outputs based on measured and extrapolated water column concentrations specific to seasonal monitoring (1995 to 2004)
Bear River and Cutler Reservoir TMDLs – January 2006 • Concentrations • Total Phosphorus • Slight increase within Bear River • Highest concentrations from the South tributaries • Substantial decrease South to North in-reservoir • Winter concentrations highest • Bear River fraction is less dissolved
Measured and projected dissolved nitrate + nitrite concentrations (mg/L) for model segments in the Bear River (vertical plot) and Cutler Reservoir (horizontal plot) PRELIMINARY RESULTS - NOT NECESSARILY REPRESENTATIVE OF FINAL VALUES Concentrations represent modeled boundary conditions and calculated outputs based on measured and extrapolated water column concentrations specific to seasonal monitoring (1995 to 2004)
Bear River and Cutler Reservoir TMDLs – January 2006 • Concentrations • Nitrate + Nitrite • Higher relative concentrations in Bear River • Highest concentrations from the South tributaries
Measured and projected total suspended solids concentrations (mg/L) for model segments in the Bear River (vertical plot) and Cutler Reservoir (horizontal plot) PRELIMINARY RESULTS - NOT NECESSARILY REPRESENTATIVE OF FINAL VALUES Concentrations represent modeled boundary conditions and calculated outputs based on measured and extrapolated water column concentrations specific to seasonal monitoring (1995 to 2004)
Bear River and Cutler Reservoir TMDLs – January 2006 • Concentrations • Total Suspended Sediment • Highest concentrations from the Bear River • Major increase between state line and Richmond • Outflow values include some scour
Bear River and Cutler Reservoir TMDLs – January 2006 • Loading • STILL VERY PRELIMINARY • Refining the ground water balance • Still refining the Segment 3 • Benson Marina to Clay Slough • Processing and transport
Measured and projected dissolved phosphorus loading (kg/year) for model segments in the Bear River (vertical plot) and Cutler Reservoir (horizontal plot) PRELIMINARY RESULTS - NOT NECESSARILY REPRESENTATIVE OF FINAL VALUES Calculated outputs based on measured and extrapolated water column concentrations specific to seasonal monitoring (1995 to 2004)
Bear River and Cutler Reservoir TMDLs – January 2006 • Loading • Dissolved Phosphorus • Slight increase in Bear upstream to downstream • Southern reservoir is major contributor • Reservoir acts as a ‘sink’ (summer) • Southern reservoir acts as a ‘sink’ winter and spring
Measured and projected total phosphorus loading (kg/year) for model segments in the Bear River (vertical plot) and Cutler Reservoir (horizontal plot) PRELIMINARY RESULTS - NOT NECESSARILY REPRESENTATIVE OF FINAL VALUES Calculated outputs based on measured and extrapolated water column concentrations specific to seasonal monitoring (1995 to 2004)
Bear River and Cutler Reservoir TMDLs – January 2006 • Loading • Total Phosphorus • Increase in Bear upstream to downstream • Reservoir acts as a sink in summer and fall • Reservoir act as a source winter and spring
Bear River Line Flow Diagram For Bear River Major Inflows to the Bear River – Cutler Reservoir Reach (Map is not drawn to scale) Cub River Summit Creek Newton Creek Clay Slough Hopkins Slough Swift Slough RR – foot bridge Logan River RR Bridge Spring Creek Cutler Dam Little Bear River Benson Road Hwy 23 Hwy 30
Measured and projected dissolved nitrate + nitrite loading (kg/year) for model segments in the Bear River (vertical plot) and Cutler Reservoir (horizontal plot) PRELIMINARY RESULTS - NOT NECESSARILY REPRESENTATIVE OF FINAL VALUES Calculated outputs based on measured and extrapolated water column concentrations specific to seasonal monitoring (1995 to 2004)
Bear River and Cutler Reservoir TMDLs – January 2006 • Loading • Nitrate + Nitrite • Higher relative loadings in Bear River (winter) • Southern reservoir acts as a ‘sink’ • Reservoir acts as a ‘sink’ in summer
Measured and projected total suspended solids loading (kg/year) for model segments in the Bear River (vertical plot) and Cutler Reservoir (horizontal plot) PRELIMINARY RESULTS - NOT NECESSARILY REPRESENTATIVE OF FINAL VALUES Calculated outputs based on measured and extrapolated water column concentrations specific to seasonal monitoring (1995 to 2004)
Bear River and Cutler Reservoir TMDLs – January 2006 • Loading • Total Suspended Solids • Higher relative loadings in Bear River (spring) • Lower Bear acts as a sink in the summer and fall • Bear River is major contributor • Southern reservoir acts as a sink in the spring • Reservoir acts as a sink in summer • Reservoir act as a source winter • Outflow values include some scour
Bear River and Cutler Reservoir TMDLs – January 2006 • Summary • Results are preliminary • Southern Reservoir has highest nutrient concentrations • Nutrient concentrations decrease south to north in-reservoir • Southern reservoir acts as a sink • Reservoir acts as a ‘sink’ for dissolved nutrients • Bear River is major source of total suspended sediment • Reservoir acts as a sink in the summer • Southern reservoir processes differently than northern reservoir – slower transport and throughput
Bear River and Cutler Reservoir TMDLs – January 2006 • Next steps • Refine the ground water balance • Refine Segment 3 • Manipulate inflow concentrations to see resulting changes in-reservoir • PREWET • Correlate water quality work with site assessment and fishery work to determine linkages with 3B and 3D support status • 3B warm water game fish and associated food chain • 3D water fowl, shore birds and associated food chain
Bear River and Cutler Reservoir TMDLs – January 2006 • Water Quality Concerns • Sediment (Bear River and tributaries) • Total Phosphorus • Dissolved Oxygen (Cutler Reservoir)
Bear River and Cutler Reservoir TMDLs – January 2006 • Designated Beneficial Uses • 2B secondary contact recreation • 3B warm water game fish and associated food chain (Bullhead, Channel Catfish, Crappie, Green Sunfish, Largemouth Bass, Walleye, Whitefish, Yellow Perch) • 3D water fowl, shore birds and associated food chains • 4 agricultural water supply