Download
1 / 39
400 likes | 420 Views
Delve into the landscape of suburban science education in the US through data sources like the American Census Bureau and NY State School Report Cards. Analyze demographic patterns, disparities, and accessibility of STEM education in suburban, urban, and rural areas.

E N D
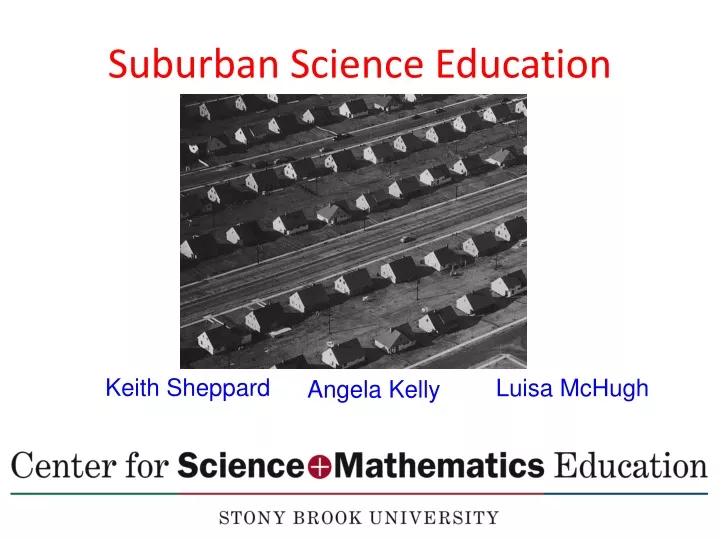
Suburban Science Education Keith Sheppard Luisa McHugh Angela Kelly
Suburban Science Education Data Sources: • American Census Bureau (2010) • New York State School Report Cards (2008-2010) • National Center for Educational Statistics • NYSED.gov
Suburban Science Education What percentages of the USA population are • Suburban • Urban • Rural ?
Suburban Science Education What percentages of the USA Population are • Suburban 50% • Urban 30% • Rural 20% “…the United States is a suburban nation…”
Suburban Science Education Google Scholar Search • Suburban Science Education • Urban Science Education • Rural Science Education
Suburban Science Education Google Scholar Search • Suburban Science Education 1 • Urban Science Education 727 • Rural Science Education 87
Suburban Science Education Science for All? Contains Chapters on Rural Science Education Urban Science Education
Suburban Science Educationand High-Needs Schools Survey of Noyce Awards Choices for Areas Served Rural Urban
Suburban Science Educationand High-Needs Schools Noyce Award Question Answer Yes. All are high needs school districts. It is a misconception to suppose that suburban schools are all low needs. • Are these truly high needs school districts? They do not mention that fact in their support letters.
New York State • Demographics • Population 19.4 million (3rd largest in USA) (60% White, 17% Black, 7% Asian and 17% Hispanic) • New York City (largest city in USA) • 8.1 million (42% of population) • New York City Metropolitan area (largest suburbs in USA) • 18.9 million
New York State Education • Demographics • K-12 Population 2.7 million • 50% White, 19% Black, 22% Hispanic, 8% Asian • New York City • K-12 Population 1.1 million • 15% White, 34% Black, 13% Asian and 38% Hispanic
New York State • Distinguishing Feature of NY Education?
New York State • Distinguishing Feature of NY Science Education? • Regents Exams • Earth Science • Over 800 school districts
New York City High needs by definition, but STEM accessibility and participation is contextual and related to poverty of local school population (Kelly & Sheppard, 2009). 55% of New York City secondary schools do not offer physics Main determinant of whether physics is offered = school size
A disproportionate number of the physics students in NYC attend the eight magnet schools. • Magnet schools have 7% of the city’s high school students, and 27% of the city’s physics students. • These competitive schools have far fewer students of color and fewer poor children than other NYC schools.
Long Island History • 19th Century – century of the Cities • 20th Century – century of the Suburbs • 1898 – consolidation of New York City • Queens elected to be part of the city • Nassau elected to be separate • Suburban government developed
Long Island • Distinguishing Feature of Long Island Education?
Long Island Science Education • 125 separate school districts • De facto segregation • Wide disparity between districts • Intel semi-finalists and finalists • High AP exam entrance • Highly paid teachers
Lowest and Highest Performing Districts on Long Island All these districts are within 20 miles of each other
Talking Points • High needs schools and suburban locations are not mutually exclusive categories • % taking Regents physics and chemistry is an effective indicator of the of whether a school is high- needs. • School size not a determinant of science offerings on Long Island • Teachers are important
Acknowledgements • We would like to thank Linda Padwa for the collection and organization of the Long Island Regents data. • We would like to thank Judy Nimmo for assistance in constructing the maps in this powerpoint.