Download
1 / 1
10 likes | 132 Views
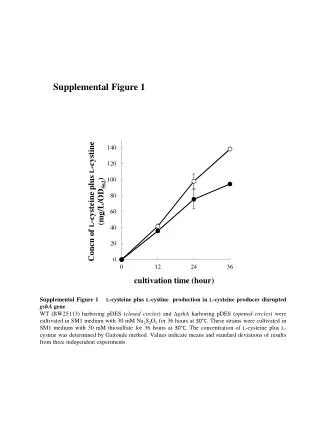
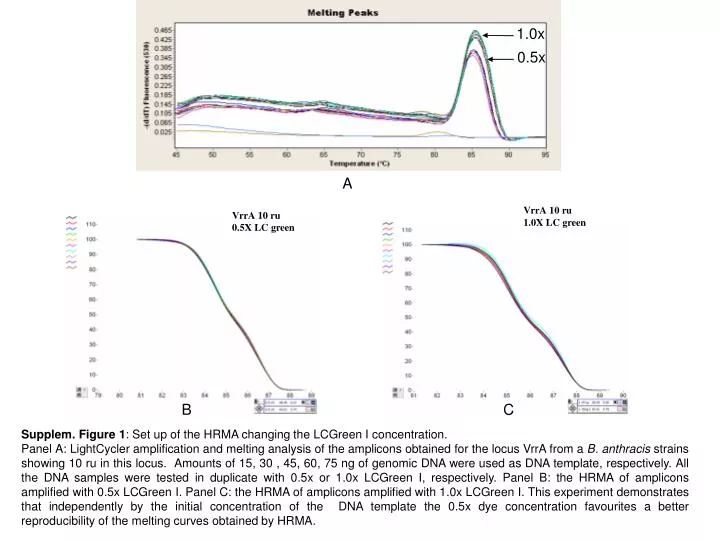
Supplem. Figure 1 : Set up of the HRMA changing the LCGreen I concentration.

E N D
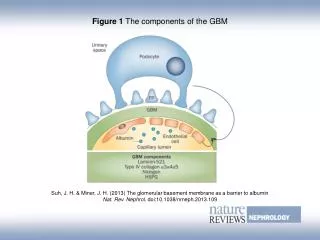
Supplem. Figure 1: Set up of the HRMA changing the LCGreen I concentration. Panel A: LightCycler amplification and melting analysis of the amplicons obtained for the locus VrrA from a B. anthracis strains showing 10 ru in this locus. Amounts of 15, 30 , 45, 60, 75 ng of genomic DNA were used as DNA template, respectively. All the DNA samples were tested in duplicate with 0.5x or 1.0x LCGreen I, respectively. Panel B: the HRMA of amplicons amplified with 0.5x LCGreen I. Panel C: the HRMA of amplicons amplified with 1.0x LCGreen I. This experiment demonstrates that independently by the initial concentration of the DNA template the 0.5x dye concentration favourites a better reproducibility of the melting curves obtained by HRMA.