Download
1 / 1
10 likes | 77 Views
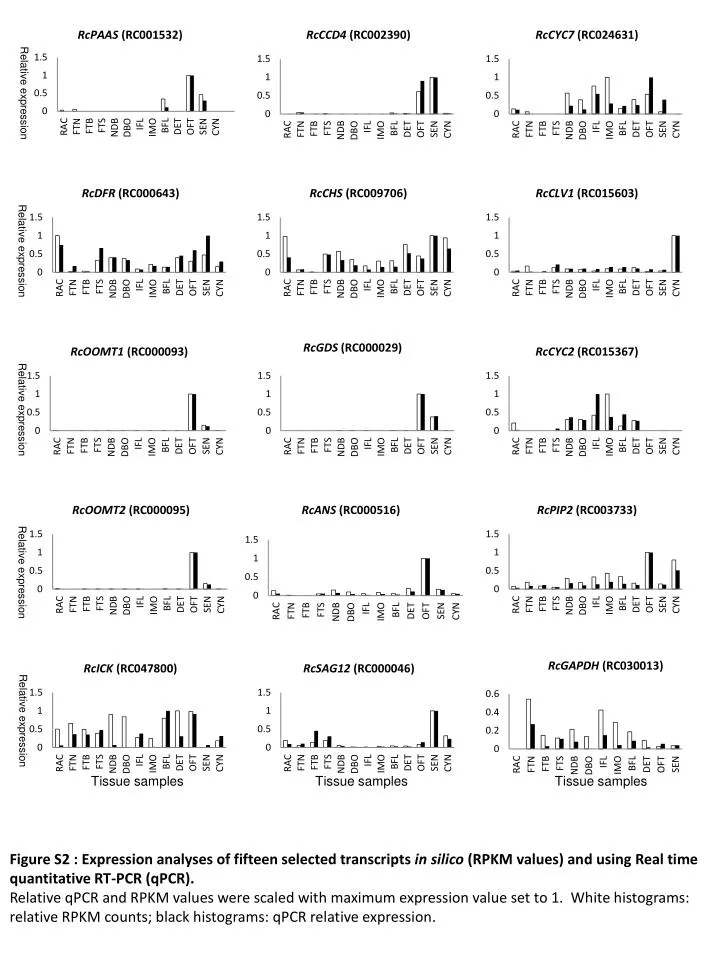
This study compares the expression levels of fifteen selected transcripts in tissue samples using in silico RPKM values and real-time quantitative RT-PCR (qPCR). The values were scaled with maximum expression set to 1. White histograms represent relative RPKM counts and black histograms show qPCR relative expression.

E N D
Relative expression Relative expression Relative expression Relative expression Relative expression Tissue samples Tissue samples Tissue samples Figure S2 : Expression analyses of fifteen selected transcripts in silico (RPKM values) and using Real time quantitative RT-PCR (qPCR). Relative qPCR and RPKM values were scaled with maximum expression value set to 1. White histograms: relative RPKM counts; black histograms: qPCR relative expression.