Download
1 / 12
120 likes | 129 Views
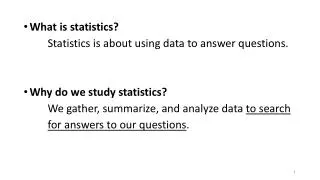
Insurance Statistics: It’s all in the data. Susan Silverman, FSA, MAAA Pi Day March 14, 2008. Examples of Insurance Statistics. Lots of statistically significant data Less data. Mortality Rates Ages 0-120 2001 CSO Male Nonsmoker. Mortality Rates Ages 0-40 2001 CSO Male Nonsmoker.

E N D
Insurance Statistics:It’s all in the data Susan Silverman, FSA, MAAA Pi Day March 14, 2008
Examples of Insurance Statistics • Lots of statistically significant data • Less data
Mortality Experience • Insurer’s own experience - Best source! • Population statistics - National Center for Health Statistics - Social Security Administration - U.S. Decennial Life Tables • Intercompany Studies by SOA and CIA
Mortality Rates – breakdowns needed • age • gender • smoking/nonsmoking • underwriting class • insurance plan • amount of insurance
Measuring your own Mortality Rates • surprisingly difficult: mortality rates are very small, and need a lot of data (exposure) to get significant results • difficult even for group insurance: Large groups are self-administered hard to get data to measure experience • 1st priority (as it should be) is to pay the claims
Population statistics Higher mortality than for insured lives, but useful for: • estimating annual improvements in mortality • ratios of mortality by age bracket • comparing male and female mortality • extending rates to the very young and very old
Mortality Experience Studies • Northampton Table (1780's): studied parish records of deaths and baptisms from 1735-1780 • Carlisle Table (1815) • tapes and 8” floppy disks • mainframe systems • contracted out to Medical Information Bureau (MIB; Braintree, MA)
2002–04 Individual Life Experience Report • www.soa.org – report and pivot tables • Data from 35 companies 1996-2000: 10-12 companies 2000-2001: 21 companies • Rapid increase + Request for more detailed information data problems • Previous report (2000-01 policy years) removed from the SOA web site – problems with some companies’ data led to overstating mortality • 2001-2002 study never published (data problems)
2002–04 Individual Life Experience Report • mortality experience in the 25-year select period was 88% of the 2001 Valuation Basic Table (VBT) by policy • Smoker vs. Nonsmoker • Term vs. Non-Term • Slope of 2001 VBT may be too steep in the early durations
Insurance Statistics:It’s all in the data Questions?