Download
1 / 100
6.93k likes | 23.81k Views
OXYGEN THERAPY. University College of Medical Sciences & GTB Hospital, Delhi. DR. RICHA JAIN. OVERVIEW. Introduction Oxygen transport Indications Oxygen delivery systems Hyperbaric oxygen therapy Complications of oxygen therapy. OXYGEN THERAPY ….. WHAT? .

E N D
OXYGEN THERAPY University College of Medical Sciences & GTB Hospital, Delhi DR. RICHA JAIN
OVERVIEW • Introduction • Oxygen transport • Indications • Oxygen delivery systems • Hyperbaric oxygen therapy • Complications of oxygen therapy
OXYGEN THERAPY ….. WHAT? Administration of O2 in concentration more than in ambient air ↑Partial Pr of O2 in insp. Gas(Pi o2) ↑Partial Pr of O2 in alveoli(PAo2) ↑Partial Pr of O2 in arterial blood(Pao2)
Why is O2 required for survival? • O2 is required for the aerobic metabolism • Oxidative phosphorylation in mitochondria • Glucose + 6O2→ 6H2O + 6CO2 + 36ATP • Lack of O2 causes • Anaerobic metabolism in cytoplasm • Glucose → lactic acid + 2ATP ↓ H+ + lactate-
“lack of O2 not only stops the machinery, but also totally ruins the supposed machinery” J.S.Haldane
What is the Oxygen Cascade? The process of declining oxygen tension from atmosphere to mitochondria Atmosphere air (dry) (159 mm Hg) ↓ humidification Lower resp tract (moist) (150 mm Hg) ↓ O2 consumption and alveolar ventilation Alveoli PAO2 (104 mm Hg) ↓ venous admixture Arterial blood PaO2 (100 mm Hg) ↓ tissue extraction Venous blood PV O2 (40 mm Hg) ↓ Mitochondria PO2 (7 – 37 mmHg)
O2 Cascade PA O2 = 104 mm Hg Alveolar air PI O2 Venous admixture PV O2 Arterial blood Pa O2 = 100 mm Hg A – a = 4 – 25 mmHg
O2 Cascade Venous admixture(physiological shunt) Low VA/Q Normal True shunt (normal anatomical shunt) Pulmonary (Bronchial veins) Extra Pulm. (Thebesian veins) Normal = upto 5 % of cardiac output
O2 Cascade Arterial blood Pa O2 = 100 mm Hg (Sat. > 95 %) Utilization by tissue Mixed Venous blood PV O2 = 40mm Hg Sat. 75% Cell Mitochondria PO2 (7 – 37 mmHg)
O2 Cascade Pa O2 = 97mm Hg (Sat. > 95 %) Arterial blood Perfusion Utilization by tissue O2 content (Hb Conc.) Mixed Venous blood PV O2 = 40mm Hg Sat. 75% Cell Mitochondria PO2 ( 7 – 37 mmHg)
What is Pasteur point ? The critical level of PO2 below which aerobic metabolism fails. (1 – 2 mmHg PO2 in mitochondria)
O2 TRANSPORT Oxygen content Oxygen flux Oxygen uptake O2 extraction ratio
Oxygen Content (Co2) Amount of O2carried by 100 ml of blood Co2 =Dissolved O2 + O2 Bound to hemoglobin Co2 = Po2 × 0.0031 + So2 × Hb × 1.34 (Normal Cao2 = 20 ml/100ml blood Normal Cvo2 = 15 ml/100ml blood) C(a-v)o2 =5 ml/100ml blood Co2 = arterial oxygen content (vol%) Hb = hemoglobin (g%) 1.34 = oxygen-carrying capacity of hemoglobin Po2 = arterial partial pressure of oxygen (mmHg) 0.0031 = solubility coefficient of oxygen in plasma
O2Hb dissociation curve % Hb Sat with O2 PO2 mmHg
Oxygen Flux Amount of of O2 leaving left ventricle per minute. = CO × Hb sat x Hbconc x 1.34 100 100 = 5000 x 97 x 15.4 x 1.34 100 100 = 1000 ml/min CO = cardiac output in ml per minute. Do2 = oxygen flux
Oxygen Uptake (VO2) • The Vo2 describes the volume of oxygen (in mL) that leaves the capillary blood and moves into the tissues each minute. • VO2 = CO x C(a-v)o2 x 10 • normalVO2 = 200–300 mL/min or 110–160 mL/min/m2
Oxygen-Extraction Ratio (O2ER) • The fraction of the oxygen delivered to the capillaries and then to tissues. • An index of the efficiency of oxygen transport. • O2ER = VO2 / DO2 = CO x C(a-v)o2 x 10 CO x Cao2 x 10 = SaO2 - SvO2 / SaO2 • Normal - 0.25 (range = 0.2–0.3)
Which patient is better placed – ? AB Hb 14gm (normal) 7gm (Anaemic) C.O. 5 L (normal) 4 L (Low) SPO2 40 % 90 % PaO2 23 mm Hg 60 mmHg O2 Flux 375ml 350ml
PO2O2 contentPer 100 ml 97mm Art. blood 14g x 1.39 x 100%=20ml 40mm Ven. blood 14g x 1.39 x 75% = 15ml Tissue extraction 25% = 5ml 97mm Art. blood 7g x 1.39 x 100% = 10 ml 27 mm Ven. Blood 7g x 1.39 x 50% = 5ml Tissue extraction 50% = 5ml
Goal of oxygen therapy To maintain adequate tissue oxygenation while minimizing cardiopulmonary work
O2 Therapy : CLINICAL OBJECTIVES • Correct documented or suspected hypoxemia • Decrease the symptoms associated with chronic hypoxemia • Decrease the workload hypoxemia imposes on the cardiopulmonary system
O2 Therapy : Indications • Documented hypoxemia as evidenced by • PaO2 < 60 mmHg or SaO2 < 90% on room air • PaO2 or SaO2 below desirable range for a specific clinical situation • Acute care situations in which hypoxemia is suspected • Severe trauma • Acute myocardial infarction • Short term therapy (Post anaesthesia recovery) Respir Care 2002;47:707-720
ASSESSMENT • The need for oxygen therapy should be assessed by 1. monitoring of ABG - PaO2, SpO2 2. clinical assessment findings.
PaO2 as an indicator for Oxygen therapy • PaO2 : 80 – 100 mm Hg : Normal 60 – 80 mm Hg : cold, clammy extremities < 60 mm Hg : cyanosis < 40 mm Hg : mental deficiency memory loss < 30 mm Hg : bradycardia cardiac arrest PaO2 < 60 mm Hg is a strong indicator for oxygen therapy
Clinical assessment of hypoxia mild to moderate severe CNS : restlessness somnolence, confusion disorientation impaired judgement lassitude loss of coordination headache obtunded mental status Cardiac : tachycardia bradycardia, arrhythmia mild hypertension hypotension peripheral vasoconst. Respiratory: dyspnea increasing dyspnoea, tachypneatachypnoea, possible shallow & bradypnoea laboured breathing Skin : paleness, cold, clammy cyanosis
MONITORING • Physical examination for C/F of hypoxemia • Pulse oximetry • ABG analysis • pH • pO2 • pCO2 • Mixed venous blood oxygenation
CLASSIFICATION DESIGNS • Low- flow system • Reservoir systems • High flow system • Enclosures PERFORMANCES (Based on predictability and consistency of FiO2provided) • Fixed • Variable
Low flow system • The gas flow isinsufficient to meet patient’s peak inspiratory and minute ventilatory requirement • O2 provided is always diluted with air • FiO2 varies with the patient’s ventilatory pattern • Deliver low and variable FiO2 → Variable performance device
High flow system • The gas flow is sufficient to meet patient’s peak inspiratory and minute ventilatory requirement. • FiO2 is independent of the the patient’s ventilatory pattern • Deliver low- moderate and fixed FiO2 → Fixed performance device
Reservoir System • Reservoir system stores a reserve volume of O2, that equals or exceeds the patient’s tidal volume • Delivers mod- high FiO2 • Variable performance device • To provide a fixed FiO2, the reservoir volume must exceed the patient’s tidal volume
How to judge the performance of an oxygen delivery system? • How much oxygen (FiO2) the system delivers? • Does the FiO2 remain fixed or varies under changing patient’s condition?
Low flow systems are Variable performance • High flow system are Fixed performance • Reservoir systems are Variable performance device
O2 Delivery devices • Low flow (Variable performance devices ) • Nasal cannula • Nasal catheter • Transtracheal catheter • Reservoir system (Variable performance device) • Reservoir cannula • Simple face mask • Partial rebreathing mask • Non rebreathing mask • Tracheostomy mask • High flow (Fixed performance devices) • Ventimask (HAFOE) • Aerosol mask and T-piece with nebulisers
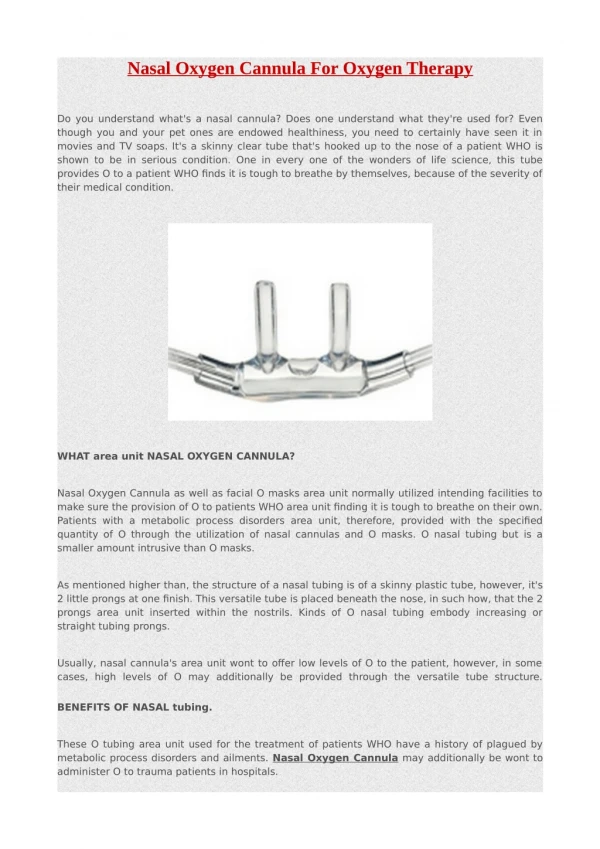
Nasal Cannula • A plastic disposable device consisting of two tips or prongs 1 cm long, connected to oxygen tubing • Inserted into the vestibule of the nose • FiO2 – 24-40% • Flow – ¼ - 8L/min (adult) < 2 L/min(child)
Nasal Cannula Merits Demerits • Easy to fix • Keeps hands free • Not much interference with further airway care • Low cost • Compliant • Unstable • Easily dislodged • High flow uncomfortable • Nasal trauma • Mucosal irritation • FiO2 can be inaccurate and inconsistent
Estimation of FiO2 provided by nasal cannula Patient of normal ventilatory pattern - each litre/min of nasal O2 increases the FiO2 approximately 4%. E.g. A patient using nasal cannula at 4 L/min, has an estimated FiO2 of 37% (21 + 16)
Nasal catheter Merits Demerits • Good stability • Disposable • Low cost • Difficult to insert • High flow increases back pressure • Needs regular changing • May provoke gagging, air swallowing, aspiration • Nasal polyps, deviated septum may block insertion
Transtracheal catheter • A thin polytetrafluoroethylene (Teflon) catheter • Inserted surgically with a guidewire between 2nd and 3rd tracheal rings • FiO2 – 22-35% • Flow – ¼ - 4L/min • Increased anatomic reservoir
Transtracheal catheter Merits Demerits • Lower O2 use and cost • Eliminates nasal and skin irritation • Better compliance • Increased exercise tolerance • Increased mobility • High cost • Surgical complications • Infection • Mucus plugging • Lost tract
Estimation of Fio2 from a low-flow system for patient with normal ventilatory pattern A patient with ideal ventilatory pattern who receives 6L/min O2 by nasal cannula is receiving FiO2of 0.44.
Estimation of Fio2 from a low-flow system The larger the Vt or faster the respiratory rate, the lower the Fio2. The smaller the Vt or lower the respiratory rate, the higher the Fio2. ↑minute ventilation → ↓ Fio2 ↓minute ventilation → ↑Fio2
Reservoir cannula NASAL RESERVOIR PENDANT RESERVOIR
Merits Demerits Reservoir cannula Unattractive Cumbersome Poor compliance Must be regularly replaced (3 weekly) Breathing pattern affects performance (must exhale through nose to reopen reservoir membrane) Lower O2 use and cost Increased mobility Less discomfort because of lower flow
RESERVOIR MASKS • Commonly used reservoir system • Three types • Simple face mask • Partial rebreathing masks • Non rebreathing masks
Simple face mask • Reservoir - 100-200 ml • Variable performance device • FiO2 varies with • O2 input flow, • mask volume, • extent of air leakage • patient’s breathing pattern • FiO2: 40 – 60% • Input flow range is 5-8 L/min • Minimum flow – 5L/min to prevent CO2 rebreathing
Face mask Merits • Moderate but variable FiO2. • Good for patients with blocked nasal passages and mouth breathers • Easy to apply Demerits • Uncomfortable • Interfere with further airway care • Proper fitting is required • Risk of aspiration in unconscious pt • Rebreathing (if input flow is less than 5 L/min)