Download
1 / 72
720 likes | 869 Views
Preparing for the Emergence of Cephalosporin-Resistant Neisseria gonorrhoeae. Robert D. Kirkcaldy, MD, MPH Division of STD Prevention. 21 July, 2011. National Center for HIV/AIDS, Viral Hepatitis, STD, and TB Prevention. Division of STD Prevention.

E N D
Preparing for the Emergence of Cephalosporin-Resistant Neisseria gonorrhoeae Robert D. Kirkcaldy, MD, MPH Division of STD Prevention 21 July, 2011 National Center for HIV/AIDS, Viral Hepatitis, STD, and TB Prevention Division of STD Prevention
Polling QuestionHow would you describe your current position? • STD Program Director • STD Program Manager • Front-line supervisor • DIS • Epidemiologist • Health Education Specialist • Clinician • Laboratorian • Other public health professional • Other
Overview • Background • History of GC resistance • Current treatment guidelines • Trends in GC cephalosporin susceptibility • Measuring antibiotic susceptibility • International trends • US trends • Programmatic Response • Challenges • Proposed response plans • Conclusions
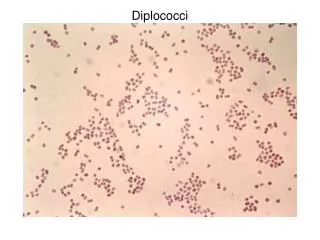
Neisseria gonorrhoeaeAntibiotic Resistance • Antibiotic resistance • Undermines treatment success • Heightens risk of complications • Facilitates transmission • Neisseria gonorrhoeae (NG) has demonstrated ability to progressively develop antibiotic resistance Resistance
Emergence of Fluoroquinolone-resistant N. gonorrhoeae(QRNG), United States FQ not recommended for GC in Hawaii* Percentage of GISP isolates resistant to ciprofloxacin Hawaii * CDC, MMWR 2000.
Emergence of Fluoroquinolone-resistant N. gonorrhoeae(QRNG), United States FQ not recommended for GC in California** Hawaii* Percentage of GISP isolates resistant to ciprofloxacin California * CDC, MMWR 2000; ** CDC, MMWR, 2002
Emergence of Fluoroquinolone-resistant N. gonorrhoeae(QRNG), United States FQ not recommended for MSM† Hawaii* California** Percentage of GISP isolates resistant to ciprofloxacin MSM * CDC, MMWR 2000; ** CDC, MMWR, 2002; † CDC, MMWR, 2004.
Emergence of Fluoroquinolone-resistant N. gonorrhoeae(QRNG), United States FQ not recommended in US‡ Hawaii* MSM† California** Percentage of GISP isolates resistant to ciprofloxacin US * CDC, MMWR 2000; ** CDC, MMWR, 2002; † CDC, MMWR, 2004.; ‡ CDC, MMWR, 2007.
Polling QuestionWhich cephalosporin do you use to treat uncomplicated cervical or urethral gonorrhea? • Cefixime • Ceftriaxone • Cefpodoxime • Doxycycline • Other • Not sure, but it must be the one in the 2010 STD Treatment Guidelines
STD Treatment Guidelines, 2010 Uncomplicated Gonococcal Infections of Cervix, Urethra & Rectum Ceftriaxone 250 mg as a single intramuscular dose (Or if not an option, Cefixime 400 mg orally in a single dose) PLUS Azithromycin 1 g orally or Doxycycline 100 mg twice daily for 7 days
Trends in cephalosporin susceptibility:measuring susceptibility
MeasuringAntibiotic Susceptibility • Disk Diffusion (Kirby-Bauer) • E-test* • Agar Dilution* • * Provide minimum inhibitory concentration (MIC): lowest antibiotic concentration that inhibits visible growth bioMérieux Clinical Diagnostics
Agar Dilution & MICs 1.00 0.50 0.25 0.125 0.060 0.030 2.00 Antibiotic concentrations
Agar Dilution & MICs 1.00 0.50 0.25 0.125 0.060 0.030 2.00 Antibiotic concentrations
Agar Dilution & MICs 1.00 0.50 0.25 0.125 0.060 0.030 2.00 Antibiotic concentrations
Agar Dilution & MICs 1.00 0.50 0.25 0.125 0.060 0.030 2.00 Antibiotic concentrations
Agar Dilution & MICs MIC 1.00 0.50 0.25 0.125 0.060 0.030 2.00 Antibiotic concentrations
Cephalosporin Susceptibility MICs • MICs of cephalosporin-resistance not defined • Don’t know what MIC is predictive of clinical treatment failure • Surveillance of cephalosporin MIC trends, rather than “resistance” • Cefixime and ceftriaxone susceptibility: ≤ 0.25 µg/ml* • “Decreased susceptibility”: ≥ 0.50 µg/ml * Clinical and Laboratory Standards Institute (CLSI), 2010
Polling QuestionDo you have access to gonococcal culture? • Yes • No • Unknown
2000 Possible cefdinir (oral) treatment failure in man with urethritis (MIC=1)
2001 2 cases with decreased cefixime susceptibility (MIC=0.5)
2002 • 30% of isolates with decreased cefixime susceptibility (MIC ≥0.5) • (0% in 1999)
2003 • 4 possible GC cefixime treatment failures in MSW • (Cefixime MICs 0.5–1)
2008 • 2% of isolates with ceftriaxone MICs ≥ 0.6 µg/ml (0.6% in 2006)
2009 • Increases in ceftriaxone MICs • Pharyngeal isolate from CSW • with Ceftriaxone MIC=2 • (subject of recent media “superbug” coverage)
2010 2 cefixime treatment failures (Cefixime MIC 0.25-0.5) ~30% with elevated (≥0.06) ceftriaxone MICs Pharyngeal treatment failure (Ceftriaxone MIC 0.125-0.25) 2 possible cefixime treatment failures (Cefixime MIC 0.25)
2011 Cefixime treatment failure (Cefixime MIC ≥ 0.25)
US sentinel surveillance Monitors trends in NG antibiotic susceptibility 26–29 STD clinic sites Urethral NG isolates obtained from first 25 men per site each month Susceptibility testing by 4–5 regional labs Confirmatory testing by CDC Minimum inhibitory concentrations (MICs) by agar dilution The Gonococcal Isolate Surveillance Project (GISP)
GISP sites and regional laboratories —United States, 2000–2010 Seattle Portland Minneapolis Detroit New York City* Philadelphia Chicago Cleveland San Francisco Baltimore Salt Lake City* Cincinnati Las Vegas* Denver Kansas City* Richmond* St. Louis* Los Angeles* Oklahoma City Greensboro* Long Beach* Orange Co. Ft. Bragg* Albuquerque San Diego Birmingham Phoenix Clinic site Dallas Atlanta Lab New Orleans Tripler AMC* Honolulu Miami Anchorage* * Did not participate for entire time period
Calculated proportion of NG isolates with elevated MICs to cefixime and ceftriaxone during 2000–2010 • Cefixime MICs ≥ 0.25 µg/ml • Ceftriaxone MICs ≥ 0.125 µg/ml
Proportion of isolates with Elevated MICs to Cefixime (≥ 0.25 μg/ml) n=52,785 1.4% (n=77) * Percentage of isolates * p trend < 0.05 Preliminary data
Proportion of isolates with Elevated MICs to Cefixime (≥ 0.25 μg/ml) by Region 3.3% (n=68) n=52,785 * Percentage of isolates * * * p trend < 0.05 Preliminary data
Proportion of isolates with Elevated MICs to Cefixime (≥ 0.25 μg/ml) by Sex of Sex Partner n=50,873 3.9% (n=64) * Percentage of isolates * p trend < 0.05 Note: MSM = Men who have sex with men; MSW = Men who exclusively have sex with women; Preliminary data
Proportion of isolates with Elevated MICs to Ceftriaxone (≥ 0.125 μg/ml) n=64,516 Percentage of isolates 0.3% (n=19) * * p trend < 0.05 Preliminary data
Proportion of isolates with Elevated MICs to Ceftriaxone (≥ 0.125 μg/ml) by Region n=64,516 Percentage of isolates * p trend < 0.05 Preliminary data
Proportion of isolates with Elevated MICs to Ceftriaxone (≥ 0.125 μg/ml) by Region n=64,516 Percentage of isolates * p trend < 0.05 Preliminary data
Proportion of isolates with Elevated MICs to Ceftriaxone (≥ 0.125 μg/ml) by Region n=64,516 Percentage of isolates 0.5% (n=11) * * p trend < 0.05 Preliminary data
Proportion of isolates with Elevated MICs to Ceftriaxone (≥ 0.125 μg/ml) by Sex of Sex Partner n=62,321 0.9% (n=15) Percentage of isolates * * p trend < 0.05 Preliminary data
Antibiotic Susceptibility Profile(n=229 isolates with elevated MICs to cefixime (≥ 0.25) or to ceftriaxone of (≥ 0.125)) All 229 isolates sensitive to Spectinomycin
Antibiotic Susceptibility Profile(n=229 isolates with elevated MICs to cefixime (≥ 0.25) or to ceftriaxone of (≥ 0.125)) All 229 isolates sensitive to Spectinomycin
Antibiotic Susceptibility Profile(n=229 isolates with elevated MICs to cefixime (≥ 0.25) or to ceftriaxone of (≥ 0.125)) All 229 isolates sensitive to Spectinomycin
Antibiotic Susceptibility Profile(n=229 isolates with elevated MICs to cefixime (≥ 0.25) or to ceftriaxone of (≥ 0.125)) Azithromycin 227 (99%) azithro-susceptible 2 (1%) with decreased azithro susceptibility (MICs 4-8µg/ml) Both were susceptible to Pen/Tet/Cipro All 229 isolates sensitive to Spectinomycin
Antibiotic Susceptibility Profile(n=229 isolates with elevated MICs to cefixime (≥ 0.25) or to ceftriaxone of (≥ 0.125)) Tetracycline 73% were TetR All 229 isolates sensitive to Spectinomycin
Summary of GISP Data • Increasing proportion of NG isolates with elevated MICs to cephalosporins during 2009–2010 • West • MSM • Isolates with elevated MICs to cephalosporins exhibited resistance to • Penicillin • Tetracycline • Fluoroquinolones • Nearly all isolates with elevated MICs to cephalosporins susceptible to azithromycin