Download
1 / 23
230 likes | 377 Views
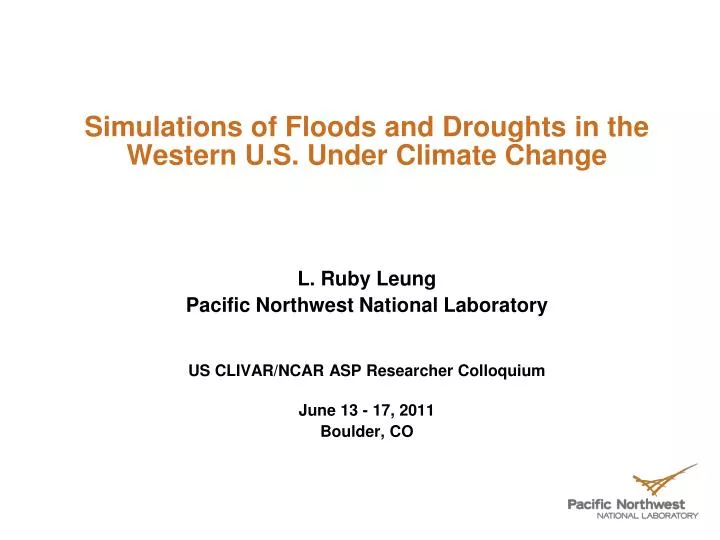
Simulations of Floods and Droughts in the Western U.S. Under Climate Change. L. Ruby Leung Pacific Northwest National Laboratory US CLIVAR/NCAR ASP Researcher Colloquium June 13 - 17, 2011 Boulder, CO. Mega-drought of the future ( Gao , Leung, Dominguez, Salath é , Lettenmaier ).

E N D
Simulations of Floods and Droughts in the Western U.S. Under Climate Change L. Ruby Leung Pacific Northwest National Laboratory US CLIVAR/NCAR ASP Researcher Colloquium June 13 - 17, 2011 Boulder, CO
Mega-drought of the future (Gao, Leung, Dominguez, Salathé, Lettenmaier) • IPCC AR4 models projected an imminent transition to warmer and more arid climate in the southwestern U.S. (Seager et al. 2007) E change P - E change P change • Focus on hydrological droughts (R= P - E): • P – E changes derived directly from GCMs • Runoff changes simulated by hydrological models driven by GCMs • Differences among GCM and hydrologic model estimates partly traced to elasticity – %change in flow per %change in precip – differences among land surface models 2
Atmospheric Moisture Convergence (AR4 GCMs) Seager et al. (2010) P – E Change (Oct – Mar) Mean Flow Convergence Transient Eddy Moisture Convergence Mean Flow Advection 3
Changes in P – E in the future • Annual P – E in the SW is primarily controlled by the positive P – E during winter, which sustains a positive annual P – E • Two main factors contribute to the reductions in P – E in the SW: • Areas influenced by mean moisture divergence get drier as atmospheric moisture increases with warming • Reduced transient eddy moisture convergence due to poleward shift of storm tracks • Can GCMs simulate realistic transient moisture flux in mountainous regions? 4
To assess the potential effects of model resolution on P – E changes • Four pairs of GCM-RCM simulations are compared: • CCSM3, CGCM3, HADCM3 (from NARCCAP) and ECHAM5 • WRF simulations driven by CCSM3 and CGCM3 are from NARCCAP (50 km resolution with A2 scenario) • WRF simulations driven by HADCM3 used a different model configuration (35 km resolution, A2 scenario, spectral nudging) (Dominguez and Castro) • WRF simulations driven by ECHAM5 used a nested model configuration (36 km resolution, A1B scenario, nudging on outer domain) (Salathé) 5
Temperature and snowpack change RCMs show less snowpack reduction RCMs show less warming Large differences among GCMs 6
Moisture flux convergence in GCMs and RCMs Drying due to divergence circulation RCMs show larger increase Increase in transient eddy fluxes! 7
Differences between global and regional models • RCMs consistently showed that the SW is less susceptible to climate change than what GCMs suggested (T, snowpack, P – E) • At higher resolution, more transient eddy moisture flux is simulated by the RCMs (compared to the GCMs) and NARR (compared to NCEP/DOE global reanalysis) • Are the changes in transient flux more realistically simulated by RCMs than GCMs? 8
Summary • Although the IPCC AR4 models show that the southwestern US is susceptible to mega droughts in the future, large uncertainties remain in the magnitude of the droughts: • Different models and ensemble members show large differences – could the results be dominated by some members with large changes? • How sensitive are the results to land surface representations – precipitation elasticity? • How sensitive are the results to model resolution – transient eddy moisture flux? 9
Changes in heavy precipitation and floods in the future (Leung and Qian) • Observations and modeling studies have suggested that extreme precipitation increases in a warmer climate • What processes are responsible for extreme precipitation in the western US? How well can regional climate simulations capture extreme precipitation and floods? • How will these processes change in a warmer climate? How will changes in extreme precipitation affect water resources? 10
Numerical Experiments • As part of NARCCAP, WRF simulations have been performed using boundary conditions from CCSM and CGCM for the North American domain at 50 km grid resolution • For each GCM, two simulations are performed for the present (1970-1999) and future (2040-2070) climate under the A2 emission scenario • WRF physics parameterizations: CAM radiation, Grell-Devenyi convection, WSM5 mixed phase microphysics, YSU non-local PBL, Noah LSM • Some NARCCAP model outputs are available from the Earth System Grid 11
Changes in precipitation rate from WRF-CCSM California Pacific Northwest Current Precipitation amount (mm) Future Central Rockies Precipitation rate (2mm/day bin) 12
Changes in mean and extreme precipitation • Changes in heavy and extreme precipitation have different spatial patterns compared to changes in mean precipitation – Are the processes responsible for changes in the mean and extremes different? D Mean D 90% D 95% WRF-CCSM WRF-CGCM 13
Atmospheric rivers and floods • Atmospheric Rivers (ARs) are narrow bands of intense water vapor transport often found in the warm sectors of extratropical cyclones • An atmospheric river was present in all of the floods on the Russian River since 1997, though not all atmospheric rivers are flood producers (Ralph et al. 2005) • Main ingredients for heavy orographic precipitation: LLJ, large moisture content, neutral stability Ralph et al. (2005) 14
Large-scale circulation associated with AR CGCM CCSM Vertically integrated moisture flux 500 hPa height and 850 hPa T 15
AR Frequency AR statistics from observations and global climate simulations Month • CGCM simulated an overall lower frequency of AR compared to observations and CCSM • Both models (75% for CCSM and 85% for CGCM) simulated a higher frequency of AR landfalling in the north coast compared to observations (61%) • Combining the CCSM and CGCM statistics produced the AR seasonal cycle most comparable to observations Normalized AR Frequency NCEP O N D J F M A M J J A S Month CCSM CGCM O N D J F M A M J J A S 16
Atmospheric rivers in regional climate simulations • The downscaled simulations generally captured the wet anomalies associated with the AR • WRF-CGCM has a more dominant wet anomaly to the north WRF-CGCM AR Precipitation Anomaly (October – March) Observed WRF-CCSM 17
GCM simulated AR changes in the future climate • The number of AR days increases by 27% and 132%, respectively, based on the CCSM and CGCM simulations of current (1970-1999) and future (2040-2069) climate • CCSM projected larger increase in AR frequency in the north compared to CGCM • There is a 7 – 12% increase in column water vapor and water vapor flux, with little change in wind speed O N D J F M A M J J A S Change in AR Frequency 18 Month
Changes in AR precipitation and runoff Change in total AR precip Change in total AR runoff WRF-CCSM WRF-CCSM WRF-CGCM WRF-CGCM 19
Contributions of AR to the 95th percentile precipitation Current Future WRF-CCSM WRF-CGCM 20
Changes in runoff/precip for mean and AR conditions Change in runoff/precip for mean Change in runoff/precip for AR WRF-CCSM WRF-CCSM October - March WRF-CGCM WRF-CGCM 21
Summary • Consistent with other studies, the WRF simulations show a shift from lower to higher precipitation rate in the future warmer conditions • Differences in the spatial distribution of mean vs extreme precipitation changes suggest that they are related to different physical/dynamical mechanisms • CCSM and CGCM simulated a 27% and 132% increase in AR frequency and a 10-12% increase in column water vapor flux associated with AR • As a result, precipitation associated with AR generally increases in the western US, particularly over the Sierra Nevada • AR contributes more to heavy precipitation in a warmer climate, particularly in northern CA • Disproportionately more runoff results from heavy precipitation events (with warmer than normal temperature) while mean runoff decreases – challenges for water management 22
Can RCMs add value? (O’Kane et al. 2009) Stationary (time-mean) • Where transient eddy variability plays a role, downscaling adds important information • Where there is strong local forcing (e.g., topography), downscaling also adds value in time mean (stationary) fields 100x • Since extreme events result from interactions between stationary and transient eddy dynamics (in the mid-latitudes), high resolution is important in capturing the characteristics of extreme events Transient 100x Transient Stationary (time-mean) Typical scale range of RCM Fine scales Large scales 2 Dx 5,000 km 23