Download
1 / 16
160 likes | 289 Views
Paper by Jorg Langner and Werner Goebl. Visualizing Expressive Performance in Tempo-Loudness Space. Presented by Vinoth Kulaveerasingam QMUL ELE021/ELED021/ELEM021 • 5 Mar 2012. Visualizing Expressive Performance in Tempo-Loudness Space. What is the aim? How is it done?

E N D
Paper by JorgLangner and Werner Goebl Visualizing Expressive Performance in Tempo-Loudness Space Presented by VinothKulaveerasingam QMUL ELE021/ELED021/ELEM021 • 5 Mar 2012
Visualizing Expressive Performance in Tempo-Loudness Space • What is the aim? • How is it done? • How is it tested?
Visualizing Expressive Performance in Tempo-Loudness Space • Data gathering and Processing: • Method to take the reading • Data Reduction • Timing • Loudness
Visualizing Expressive Performance in Tempo-Loudness Space • Method to take the reading: • Special recording • Midi (Musical Instrument Digital Interface), It is a system which records music. • Audio recording (AR) • Original piece of music. • Data Reduction: • Windowing (smoothed) • Take section of music (in this case very close to one bar of played music), smoothed using the Gaussian window.
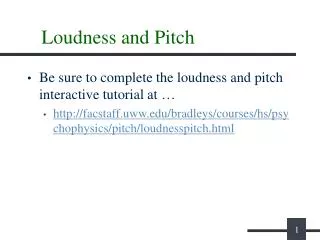
Visualizing Expressive Performance in Tempo-Loudness Space • Timing: • Special recording • Midi has a built onset recognizer. • AR: • Interactive software tool for automatic beat detection. • Detect as many onset as possible then compute the beat. • The beat can be corrected manually. • Loudness: • Zwicker’s loudness model • Measured in sones.
Visualizing Expressive Performance in Tempo-Loudness Space • Display: • After all the data has been gathered, it is been is played into a two dimension space of tempo (on the x axis) and loudness (on the y axis):
Visualizing Expressive Performance in Tempo-Loudness Space • Case Study 1 : Chopin’s E-Major Etude • 3 samples of music • Pianist 9 • Pianist 18 • Maurizio Pollini • The first two pianists (Pianist 9 and 18) has been asked to play until bar 21 of the “Chopin’ s Etude” on a Bosendorfer SE290 • The aim is to see the correlation between Tempo and Loudness in a visual way.
Visualizing Expressive Performance in Tempo-Loudness Space • Pianist 9:
Visualizing Expressive Performance in Tempo-Loudness Space • Pianist 18:
Visualizing Expressive Performance in Tempo-Loudness Space • Maurizio Pollini:
Visualizing Expressive Performance in Tempo-Loudness Space • Case Study 2 : Schubert’s G-Flat-Major Impromptu • 2 samples of music • Alfred Brendel (1997) • Todd Hybrid Model • The aim of this study is to see if Neil Todd’ s model about Tempo and Loudness is true. He stated that : “The faster the louder, slower the softer”
Visualizing Expressive Performance in Tempo-Loudness Space • Comparison of the two samples:
Visualizing Expressive Performance in Tempo-Loudness Space • Analysis of each sample: • Alfred Brendel (1997) • Todd Hybrid Model • It is not perfect “faster-louder” model. • Different parameter for timing and intensity were chosen. • The loudness unit is in sone. • Comparison: • Difference is huge.
Visualizing Expressive Performance in Tempo-Loudness Space • Analysis of the experiment: • Increase in tempo then loudness • Counter clockwise movement of the Tempo-loudness graph • To be proven by future experiments: • Increase loudness at maximum tempo • Decrease tempo at maximum loudness • Decrease loudness at minimum tempo • Increase tempo at loudness minimum
Visualizing Expressive Performance in Tempo-Loudness Space • Future: • Many future application • Help musician to understand better. • Can be used to teach music
Source • Langner J. & Goebl W. (2003). Visualizing Expressive Performance in Tempo-Loudness Space. Computer Music Journal, 27(4): 69-83.