Download
1 / 68
690 likes | 868 Views
RiVAMP training session Quantifying the role of ecosytems. www.grid.unep.ch. Pascal Peduzzi, Bruno Chatenoux and Adonis Velegrakis UNEP/GRID-Geneva. Risk and Vulnerability Assessment Methodology development Project (RiVAMP) Kingston, 5-8 December 2011. Work plan. Work plan.

E N D
RiVAMP training session Quantifying the role of ecosytems www.grid.unep.ch Pascal Peduzzi, Bruno Chatenoux and Adonis VelegrakisUNEP/GRID-Geneva Risk and Vulnerability Assessment Methodology development Project (RiVAMP) Kingston, 5-8 December 2011
University of Geneva R. Harding B. Chatenoux C.Herold G. Giuliani P.Peduzzi A. Velegrakis Global Change & Vulnerability Unit Global Change & Vulnerability: a unit of the UNEP/GRID-Europe UNEP DEWA DEWA DEPI DTIE DRC DCPI DGEF UNEP/GRID-Geneva SwissEnv. Agency Global Change & Vulnerability Unit (ex Early Warning)
Data (SDI) Field data collection Image analysis Statistical analysis Spatial analysis (GIS) Maps & Info PREVIEW 1999 - 2010 Global Change & Vulnerability Unit
What are the drivers of global change? Population distribution change between 1975 and 2011 World Population 1975: 4.1 billion 1990: 5.3 billion 2011:7.0 billion
More than 50% of world population is now urban… … and about a third of urban population lives in slums
Glaciers: Precipitations’ buffers and water tanks.
1979 2007
Future projections Future sea level (rel. to 1990) based on IPCC AR4 global temperature projections Full range: 75 – 190 cm by 2100 constant rate 3.2 mm/year Vermeer & Rahmstorf, PNAS 2009
Driver 1: Sea level rise (ASLR), process S, coastal retreat, α, sea level rise Fig.1 Beach erosion (defined as irreversible coastline retreat) due to increased sea level
Driver 2: Tropical cyclones & SST North Atlantic tropical cyclones by temperatures
1 Env’ factors, climate change & Tropical Cyclones Disaster Risk in SIDS Associate scientific quantitative analysis together with local expertise and community consultations 2 3 Quantifying the role of ecosystems and climate change on risk 4 Identifying local perspectives for developments 5 Provide capacity building, to multiply these assessments. Targeting audience at governments (both local and national levels) to achieve better land planning. 6 Aims of RiVAMP
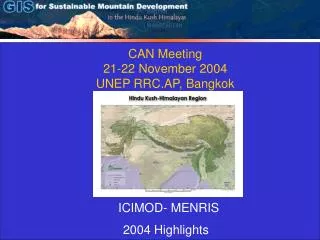
Study area: Negril Erosion rate between 1968-2006 : 0.5 and 1 m/yr(large temporal and spatial variability; Smith Warner International, 2007) Observation 2006-2008, shows that beach erosion continues (UNEP, 2010)
Aims of the spatial analysis • Evaluate the scale of beach erosion and coastal ecosystem degradation; • Identify the role of geomorphology (bathymetry, elevation) and natural features (coral, sea- grass) in the observed erosion patterns; • Prognosis under different Sea Level Rise scenarios and under increases in the frequency/intensity of tropical cyclones. • Identify population and infrastructures exposed to tropical cyclones storm surges.
Current beach erosion rate Erosion rate between 1968-2006 : 0.5 and 1 m/yr(large temporal and spatial variability; Smith Warner International, 2007) Observation 2006-2008, shows that beach erosion continues (UNEP, 2010)
Beach erosion: the drivers • Sea level rise • Storm surges from tropical cyclones. • Waves from storms • Decline of ecosystems • Presence of infrastructures Hypothesis (not comprehensive)
Beach erosion Scenarios
Beach erosion Scenarios
Driver 2: Tropical cyclones, generated waves Sources: SWI, 2007. Key: Hs = significant wave height; Period = significant wave period; Max. combined sea level elevation, sum of inverse barometric pressure effects, long-term sea level rise (assumed at 5 mm/yr) and tidal effects (0.3 m above Mean Sea Level on springs).
Driver 3: High waves Numerical model results for wave heights (a) and wave-induced currents (b) at the Negril coast. Conditions: Offshore wave height (Hrms) = 2.8 m, Tp=8.7 s. Wave approach from the northwest. Note the diminishing wave heights and changed nearshore flow patterns at the lee of the shallow coral reefs.
Driver 4: Decline of ecosystems Does the ecosystems (coral, seagrass) provide protection against beach erosion ? Sea grass and coral reef are declining (see later)
6m depth Profiles Erosion Data extraction
Driver 4: Multiple regression analysis Erosion rate behind sea grass The model explains 41% of the erosion (correlation r=0.64). Sea grass, slopes and waves were selected as significant parameters in the model. Sea grass plays the main role (47%): the wider the sea grass the less the erosion.
Driver 4: Multiple regression analysis Erosion rate behind coral The model explains 83% of the erosion (correlation r=0.91). Coral width and slopes were selected as significant parameters in the model. Width of coral plays the main role (59%): the wider the coral the less the erosion.
Coastal ecosystem importance: beach protection by coral reefs Waves H=2.8 m, T= 8.7s Fig. 9b. Modelled bed shear stress (force per unit area) (SBEACH model) induced by waves in the Negril coastal zone, showing the protection effects of inshore coral reefs Sea level rise 1m
Coastal ecosystem importance: beach protection by seagrass meadows Without meadows Fig. 11. Modelled bed shear stress (force per unit area) (SBEACH mode (wave height 1 m, period 6s) in the Negril coastal zone The seagrass meadows spread the wave force on wider area and dissipate wave energy With meadows
Exposure to tropical cyclones Flooded area Reclassification of elevation grid
Exposure to tropical cyclones Population exposure 1 km grid 10 yrp: 478 people exposed 50 yrp: 2 487 people exposed Population on the littoral area: 18 500
Exposure to tropical cyclones Assets exposure 10 yrp 50 yrp
Stakeholder consultations Quatre Bornes, September 2010
Study Area: Negril • Whitehall • Little Bay • National level • Negril Parish level • Communities
Major Types of Ecosystems in Jamaica • Coral reefs • Coastal vegetation: sea grasses, mangroves and other types of beach vegetation • Wetlands / peatlands (the “morass”) • Forests
Community profile: Little Bay • Small, rural community of about 350 residents • Highly exposed to storm surges and strong winds due to hurricanes
Community profile: Whitehall • Experienced rapid growth in past 30 years, mainly due to the expansion of tourism • Frequent flooding due to heavy runoff
Methods used • Break out group sessions • Community mapping (past and present) • Hazard mapping • Seasonal calendars • Ranking exercises
Key livelihoods depend on natural resources but contribute to ecosystem degradation • Fishing • Farming • Tourism • Fuelwood production
Environmental degradation increases local exposure and vulnerability to hazards Storm surges in Little Bay • Increased storm surge-related flooding over the past 20 years • Attributed to beach erosion, hurricanes, coral reef degradation, removal of coastal vegetation (mangroves, fruit trees and sea grasses) and illegal sand mining
Local coping strategies stress the importance of ecosystem protection • Depending on hurricane damage, residents may be forced to rely on unprotected groundwater sources for drinking and wood sources for fuel and housing materials. • Local reliance on natural resources in post-hazard contexts highlights the importance of protecting ecosystems to ensure continued access to these services.
Priority Issues and Proposed Solutions Negril faces 3 main options: • Change nothing, • Managed retreat • Coastal engineering • Improve the protection of coastal ecosystems
Results from the Project Evaluation A project evaluation was undertaken on 14-15 May 2010 (summary) • Needs an economic analysis. • Should start by defining long-term development needs. Then environment role(s) will follow. • Limited timeframe; limited space for hands-on learning by local partner(s). • Missing a third component: running scenarios with local / national land-use planning authorities • UNEP provided added value as an external actor. • Very good data collection and generation, including new satellite images at very high resolution. • Successfully demonstrated the role of ecosystems for mitigating shoreline erosion and climate change scenarios. • High government buy-in at all levels. National media coverage. +
Forest: less biomass produced We thought that with more CO2, there would be more photosynthesis, thus more biomass (Nemani et al. 2003). But it is not the case. Water might be the limitation factor (Zao & Runnin, 2010) Figure 2 Spatial pattern of terrestrial NPP linear trends from 2000 through 2009 sources: with kind permission of Zhao and Running, 2010. More CO2 was supposed to increase photosynthesis (Nemani et al., 2003). But recent measurements on the warmest decades (2000-2009) show that the creation of biomass is slower. (Zao & Running, 2010) Photosynthesis also request H2O, which may be the limiting factors